🛠️ SysQ Tools

Tools
🛠️ Performance Framing Graph (PFG)
Tools
Performance Framing Graph (PFG).
A trend over time graph — or reference behavior pattern — of the system behavior(s) you want to understand and improve by applying SysQ
About
Performance Framing Graphs are powerful visual tools that map the interests, concerns, and performance metrics of diverse stakeholder groups within a system. These graphs reveal interconnections among different perspectives, expanding everyone's field of vision beyond their immediate concerns. By visually representing each stakeholder's key metrics over time, Performance Framing Graphs (PFGs) can:
-
facilitate cross-boundary collaboration
-
highlight potential tensions and synergies
-
support the development of more inclusive strategies
PFGs are particularly valuable in addressing complex adaptive challenges that span organizational boundaries because they translate diverse perspectives into actionable insights, balanced scorecards, and comprehensive performance indicators that reflect the whole system rather than isolated parts.

Case Studies
Private Sector | Production and Order Fulfillment for a Multinational Engine Company
A cross-siloed management team at an engine production company was assigned the task of improving production. The concerning issue was that average time between receiving an order and fulfilling it had been steadily climbing (with seasonality) over the past few years.
Highlights
Each team member first created their proposed most important performance framing graph. Some were concerned with revenue loss. Others focused on customer satisfaction. Others believed maintaining supply inventory was the most important. Through small and large group discussion, the team members shared their individual graphs, explored similarities and differences, and refined their thinking into a single graph.
The final graph (shown above) was a normalized performance measure (average weeks in the backlog). They were focused on quarterly reporting, so used quarters as the unit of time. Although there was some seasonality to the trend as pictured by oscillations, the average was steadily climbing.
There was some evidence to indicate that customer satisfaction and sales would decrease if average weeks approached 3 weeks. They were approaching this limit at an alarming rate. The price paid might be significantly less sales, lower profitability and dissatisfied shareholders.
The team’s desired future was to bring average weeks in backlog to less than historical levels. Discussion led to more realistic expectations — their desired future indicated that an effective strategy might take a few months before it had an impact. Team members assumed improvement would ultimately exhibit diminishing returns as the strategy would cause average weeks to reach a new floor. For simplicity, they left out seasonality in their future vision.
The graph provided the key performance measure the system dynamics model must explain — what policies, decisions and investments are responsible for the performance and what changes must be made to create their vision of a new and much lower floor.


Tools
🛠️ SysQ Toolkit — Overview
TOOLS
Attribute of Tools
Lorem ipsum dolor sit amet, consectetur adipiscing elit, sed do eiusmod tempor incididunt ut labore et dolore magna aliqua
About
Overview of the attribute. Lorem ipsum dolor sit amet, consectetur adipiscing elit, sed do eiusmod tempor incididunt ut labore et dolore magna aliqua. Ut enim ad minim veniam, quis nostrud exercitation ullamco laboris nisi ut aliquip ex ea commodo consequat. Duis aute irure dolor in reprehenderit in voluptate velit esse cillum dolore eu fugiat nulla pariatur. Excepteur sint occaecat cupidatat non proident, sunt in culpa qui officia deserunt mollit anim id est laborum.
The SysQ AIM (Mindset) and SysQ APTITUDE (Thinking Skills) guide us in seeing the world and analyzing complex challenges, but it’s the Tools that make our thinking visible, shareable, and actionable. These tools aren’t just ideas; they’re practical instruments that help us map, understand, and improve the systems that shape our lives. From simple SysQ Questions that can be used in any meeting to sophisticated simulation models that predict system behavior, each tool has a specific purpose in turning complex challenges into manageable opportunities.
Think of these tools as different lenses through which we can examine reality — each one revealing different aspects of the same system. Just as a carpenter wouldn’t use only a hammer for every job, systemic intelligence practitioners need multiple tools to effectively understand and influence complex systems. The key is knowing which tool to use when and how to combine them for maximum impact. In the following sections, we’ll explore each tool in detail, showing you not just how to use them, but when and why they’re most effective.
IT’S EASY TO FOCUS ON THE TOOLS FIRST
During the 1990s, organizational learning became the leadership fad du jour, with “systems thinking” becoming one of the biggest buzzwords of the decade. Everyone wanted to be systems thinkers. The Fifth Discipline, The Fifth Discipline Fieldbook, and The Systems Thinker1 accelerated a broad diffusion of systems thinking tools and techniques that were adopted by private sector organizations, NGOs, schools, and communities.
accelerated a broad diffusion of systems thinking tools and techniques that were adopted by private sector organizations, NGOs, schools, and communities.
Systems archetypes were the most popular tools. These are recurring behavior patterns found in various systems. For instance, one archetype is called Shifting the Burden to the Intervenor.
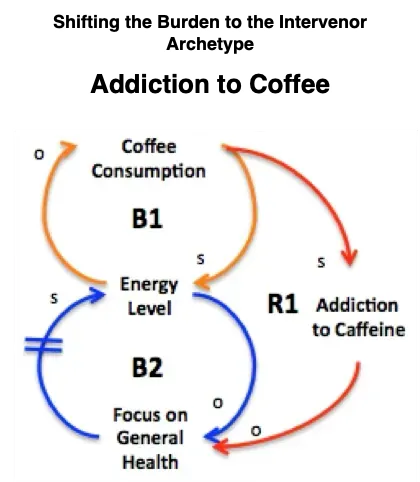
This is when a company relies too heavily on external consultants to solve problems they could solve themselves. It’s also when someone becomes overly dependent on coffee to boost energy instead of getting enough sleep, eating well, and exercising; with changes to a few words it also applies to using alcohol to address anxiety.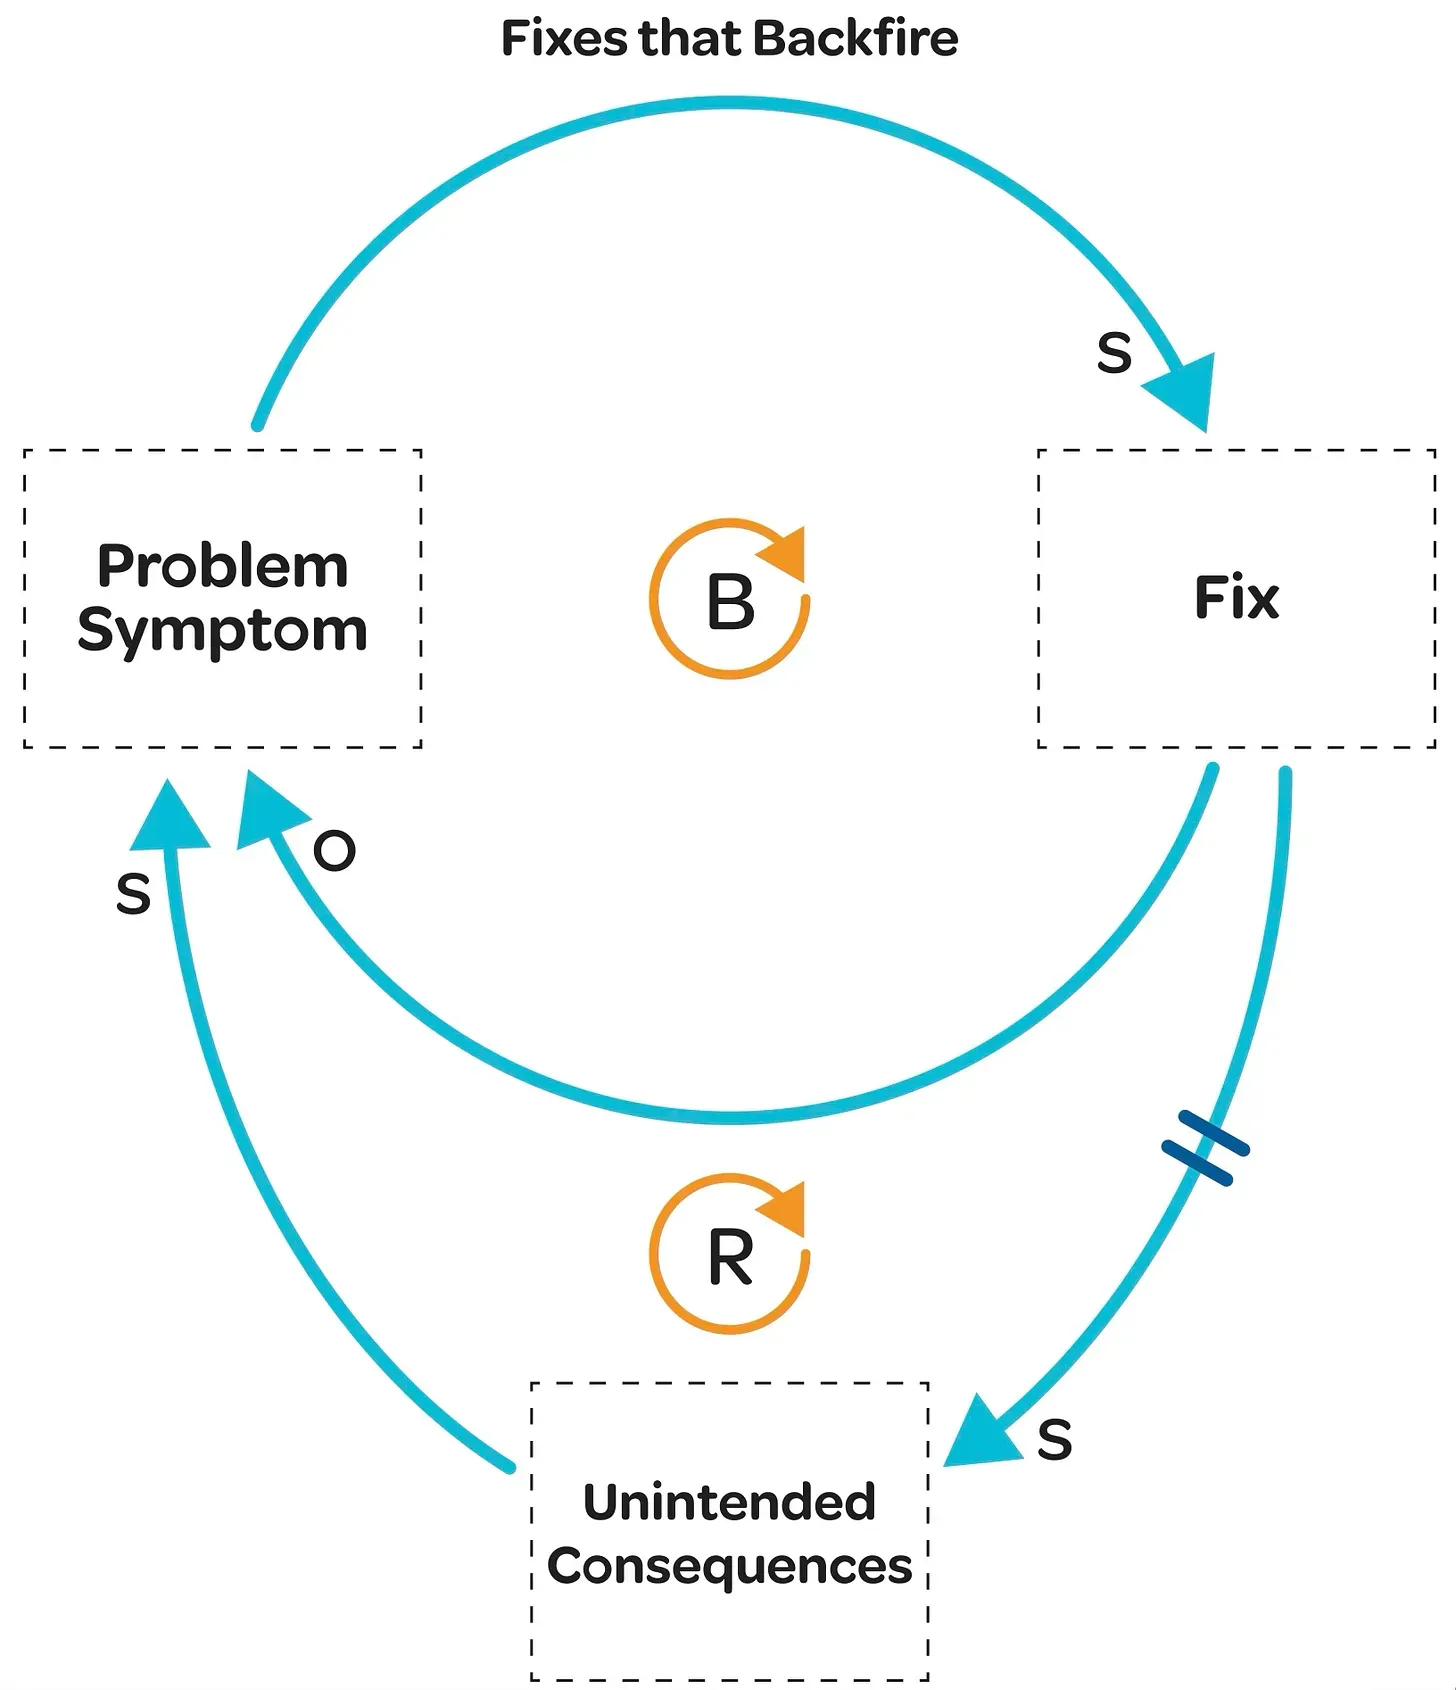 Archetype here from The Waters Center for Systems Thinking
After studying many different systems, from businesses to ecosystems (even families), experts in the field identified a few common behaviors. Eventually, the systems thinking field settled on nine archetypes (like Fixes that Backfire,Shifting the Burden to the Intervenor, and Success to the Successful).
Fixes That Backfire, sometimes referred to as Fixes That Fail, is shown above. Besides using this substack, you can learn more about Fixes That Fail and the other archetypes from the Waters Center for Systems Thinking.2
These archetypes were helpful and easy to understand, so many people who wanted to use systems thinking got excited about them and only used these tools.
But there are many other tools and techniques that should be part of the SysQ toolbox. Some are easier to learn and apply than the archetypes. Others take years to master, but the insights and learning they offer are worth it.
ARTIFACTS (APPLICATIONS and TOOLS)
There are myriad tools — of varying complexity — you should put in your SysQ Toolkit. They include:
SysQ Questions
a set of carefully crafted inquiries that can be used in any conversation to quickly surface systemic patterns and relationships, making them perfect for meetings and initial problem exploration
Behavior Over Time Graphs
help visualize how key variables change through time, revealing patterns and trends that might otherwise remain hidden in the complexity of data and stories
Multi-solving Tools
tools like FLOWER,3 guide us in finding solutions that address multiple challenges simultaneously, maximizing the impact of our interventions while minimizing unintended consequences
Systems Archetypes
recurring patterns of behavior found across different contexts and industries, serving as diagnostic tools to identify common systemic structures that often lead to problematic outcomes
Causal Loop Diagrams (CLDs)
map the circular nature of cause and effect in systems, helping us visualize how different variables influence each other and create feedback loops that drive system behavior
Stock and Flow Main Chains
identify the core structure of systems by tracking the accumulation (stocks) and movement (flows) of resources, information, or other variables that are central to the system's behavior
Stock, Flow and Feedback Maps
combine the power of stocks, flows, and feedback loops to create comprehensive visual representations of complex systems, revealing both structure and behavior
System Dynamics Models
computer simulations that bring these maps to life, allowing us to test different scenarios and policies before implementing them in the real world, providing the highest level of confidence in our understanding of system behavior
OPTIMAL TOOL? USES MINIMUM EFFORT / RESOURCES TO ACHIEVE REQUIRED CONFIDENCE
Each of these tools is like a special tool in our toolbox for understanding and changing complex systems. Some are easy to learn and use right away, while others take a bit more time and effort, but they give us deeper insights. The key is to know which tool to use when and how to mix them together to solve the problems we’re facing.
Many of these SysQ tools have been around for a while, and my colleagues and I have come up with some new ones to make it easier to use SysQ. For example, the SysQ Questions were created when I was teaching public health practitioners how to quickly improve the level of systemic rigor in conversations without having to use some of the more time-consuming visual tools.
There are at least two ways to figure out if these tools are worth using. One way is to think about what you want to achieve with them. The main goal of all these tools and techniques is to make your mental model (the way you understand the world) better, more accurate, and more reliable. In other words, the tool should make you feel more confident that you understand the underlying forces (the basic things that make things happen) that are causing the performance you want to change or improve.
Building simulation models, if done well, creates the most confidence — because they must be internally consistent and use quantifiable data. Creating stock and flow maps can also give you a lot of confidence because they’re the foundation of simulation models and could be simulated if you added data to them. But since we can’t always predict how things will change without a computer, we don’t have as much confidence in our ideas as if we had a simulation model. The chart below isn’t based on any research or has any exact numbers.
 Another thing to consider is how much time it takes to learn and use each tool. SysQ says that tools that are easy to learn usually take less time to apply and use. For example, people can learn the SysQ Questions in a few hours and immediately apply them in meetings. But the skills of a good simulation modeler take months or even years to learn, and it can take several months working with an organization to develop a simulation model that gives you confidence in your insights.
Skilled SysQ practitioners are like tool experts who introduce and teach specific tools at the perfect moment. They help clients apply the tools in the right order based on their learning goals and what they want to achieve.
A VISION FOR CAPACITY BUILDING
Barry Richmond vision was everyone could learn systems thinking — at some level. It’s an innate intelligence that can be increased.4 Barry, when teaching system dynamics modeling to various multinational organizations, would show a Venn diagram (below) that suggests everyone should be able to read system maps, many should be able to draw simple maps, and a few should be able to build good simulation models. I’ve updated his original diagram to include additional tools used by other practitioners.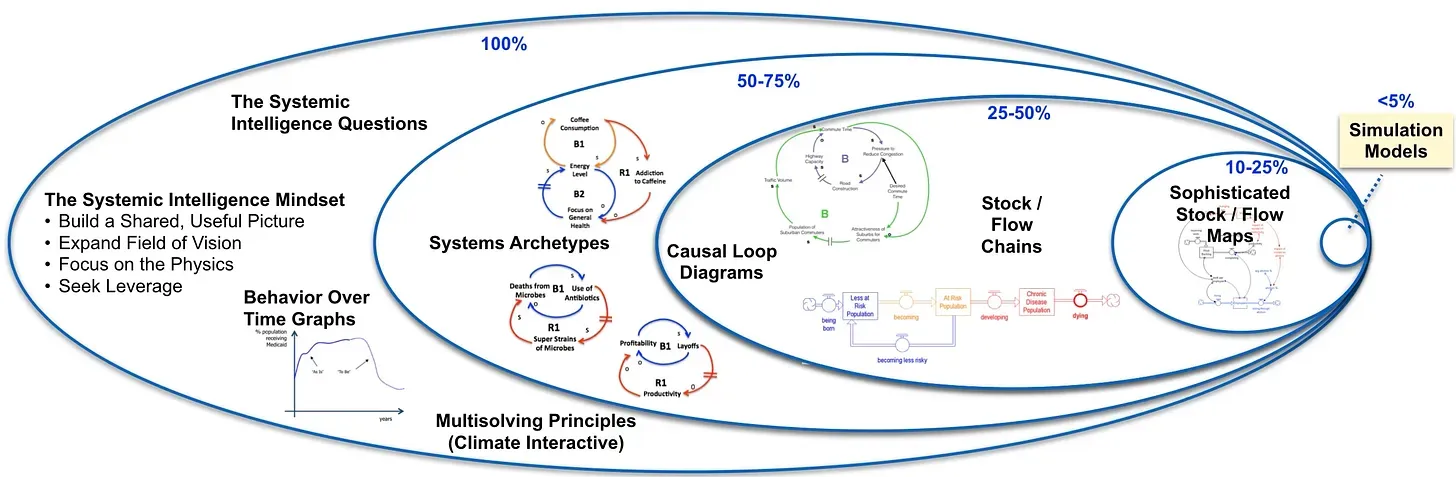 Based on my experience teaching many of the SysQ tools above, I believe an ideal distribution of competency would see everyone using the mindset and SysQ Questions. Most would be able to read and apply archetypes, a few would be able to draw useful system maps, and a small percent would be able to develop simulation models. Such a distribution would create an ecosystem of creators, curators, and consumers of SysQ artifacts and insights.
The time it takes to learn and apply the tools and techniques increases exponentially the further right in the diagram. It takes a lot more time and skill to develop a map than to draw a behavior over time graph. And it takes exponentially more to develop a simulation model with dynamic questions and data. However, the amount of confidence in the insight generated from using tools on the right goes up. The type of insight and amount of time available are major factors in deciding which tool(s) would be most appropriate for your work.
“The framework, tools, and language of system dynamics should be accessible to all. Anyone can do this at some level, and everyone should try!”
–Barry Richmond
A WORD OF CAUTION ABOUT TOOLS: SOMETIMES WE CLING TO THEM AT OUR PERIL
We tend to cling to our tools — even when they’re not the best fit for the situation. Remember the saying, ‘a hammer looks like a nail’? Firefighters risk their lives by not putting down their tools when they need to run away from a wildfire.
“In Montana’s 1949 Mann Gulch fire, made famous in Norman Maclean’s Young Men and Fire, smokejumpers parachuted in expecting to face a “ten o’clock fire,” meaning they would have it contained by 10 a.m. the next morning. Until the fire jumped across the gulch from one forested hill slope to the steep slope where the firefighters were, and chased them uphill through dry grass at eleven feet per second. Crew foreman Wagner Dodge yelled at the men to drop their tools. Two did so immediately and sprinted over the ridge to safety. Others ran with their tools and were caught by the flames. One firefighter stopped fleeing and sat down, exhausted, never having removed his heavy pack. Thirteen firefighters died. The Mann Gulch tragedy led to reforms in safety training, but wildland firefighters continued to lose races with fires when they did not drop their tools.”5
Although the failure to set aside our favorite tools may not often have as deadly a consequence as firefighters who fail to do so, we can still be led astray. One common practice is to only apply systems archetypes to an organization’s problems. Newly minted “systems thinkers” may acquire a laminated chart of all the archetypes and scan it to understand all problems. Often an archetype doesn’t apply, so any insight from the chart is most likely unfounded — sometimes it could lead to a bad strategy.
In the case of the Challenger disaster, the standard tool was a having a “solid quantitative case” that the o-rings would be unable to withstand the unusually cold Florida temperatures. The Thiokol engineers who cautioned against giving the mission the green light couldn’t provide the rigorous analysis the managers at NASA required — their standard for the go/no go decision.
“NASA’s Mulloy [one of their senior managers] later argued that he “would’ve felt naked” taking Thiokol’s argument up the chain of command. Without a solid quantitative case, “I couldn’t have defended it.”
The very tool that had helped make NASA so consistently successful, what Diane Vaughan called “the original technical culture” in the agency’s DNA, suddenly worked perversely in a situation where the familiar brand of data did not exist. Reason without numbers was not accepted. In the face of an unfamiliar challenge, NASA managers failed to drop their familiar tools.”6
SUBSTACK MISSION: TEACH WHEN AND HOW TO USE EACH TOOL
Systemic intelligence is all about having the right tools at the right time to understand and influence our complex world. Imagine a master craftsperson’s toolkit, each SysQ tool has a specific purpose. From the quick-to-learn SysQ Questions that can transform any conversation, to the more sophisticated simulation models that can predict system behavior with amazing accuracy. The cool part is that this toolkit is scalable, so everyone can learn to use basic tools to improve their understanding, while those who invest more time can develop deeper capabilities to tackle more complex challenges.
What makes these tools truly powerful is how they work together to build our systemic intelligence. Whether you’re trying to improve organizational performance, address environmental challenges, or solve community issues, these tools provide a structured way to see beyond surface-level symptoms to understand and influence the underlying patterns and relationships that drive system behavior. By mastering these tools, you’ll develop the essential capacity needed to navigate and succeed in today’s interconnected world.
By exploring this substack, you’ll be able to answer:
Why should you use each tool and under what circumstances?
How does that tool work? When applied by an individual? When applied by a team or an organization?
How do you build and deepen proficiency to use each tool?
How do you teach the tools others?
How do you use to facilitate team learning?
“Man must shape his tools lest they shape him.”
—Arthur Miller
Additional Resources
Books
Book title as link | Description
Articles
Article title as link | Description
Online Resources
Resource title as link | Description
Tools
🛠️ Performance Framing Graph
TOOLS
Attribute of Tools
Lorem ipsum dolor sit amet, consectetur adipiscing elit, sed do eiusmod tempor incididunt ut labore et dolore magna aliqua
About
Overview of the attribute. Lorem ipsum dolor sit amet, consectetur adipiscing elit, sed do eiusmod tempor incididunt ut labore et dolore magna aliqua. Ut enim ad minim veniam, quis nostrud exercitation ullamco laboris nisi ut aliquip ex ea commodo consequat. Duis aute irure dolor in reprehenderit in voluptate velit esse cillum dolore eu fugiat nulla pariatur. Excepteur sint occaecat cupidatat non proident, sunt in culpa qui officia deserunt mollit anim id est laborum.
Purpose
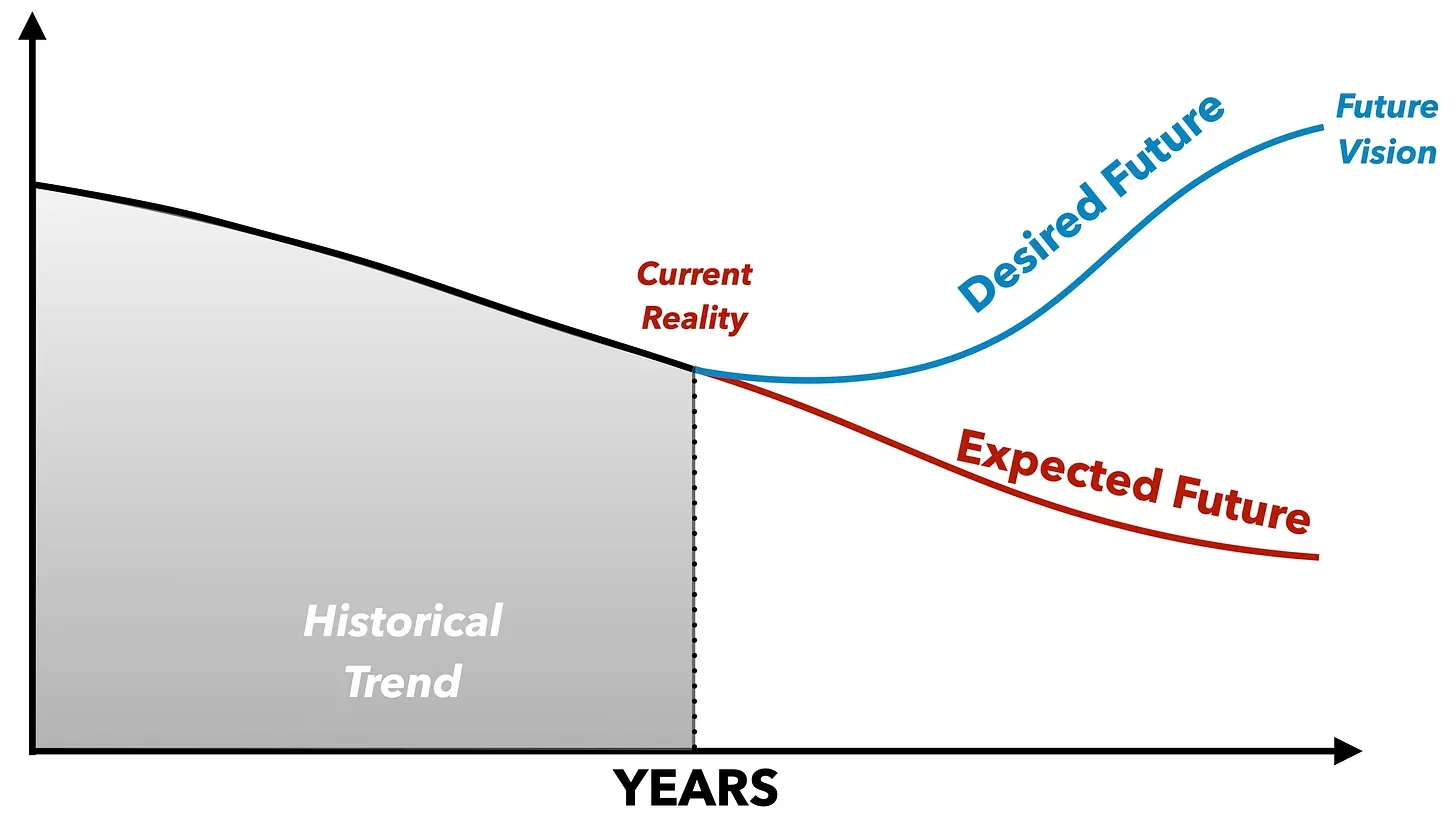
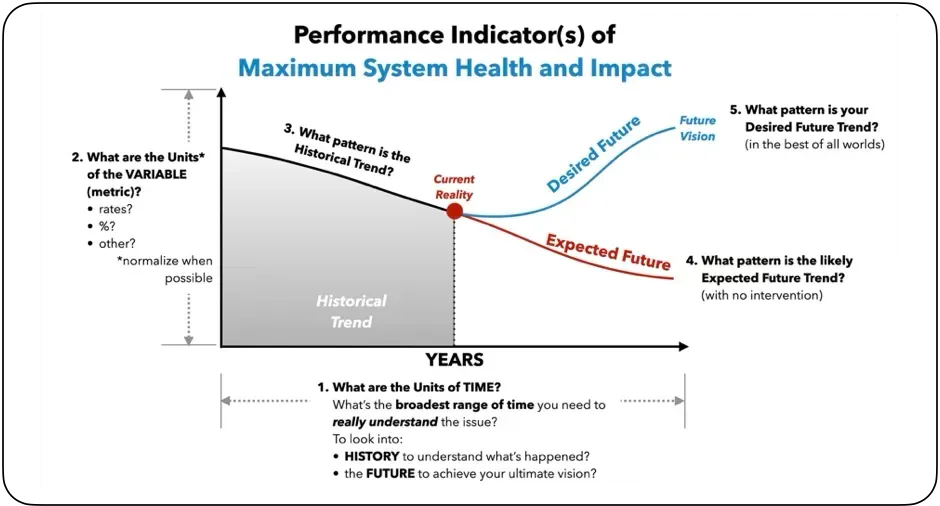
The Performance Framing Graph is like a visual map that helps us understand the systemic nature of the challenge. It shows us the desired future (vision), what we have now (current reality), and the gap between the two.
This graph is highly useful when we’re starting to solve problems or come up with strategies for adaptive challenges. It can also be helpful for regular problems.
Drawing performance framing graphs helps us think more dynamically — about any issue, simple or complex. They boost our DYNAMIC Thinking capacity.
VALUE & OUTCOME
If done well, it provides you and your team or coalition with the following information:
What’s the current reality of the issue we want to improve?
How did we get here…and what’s the historical trend?
What’s the price paid if the issue remains unsolved?
What’s our ideal future if we could wave a magic wand?
The performance framing graph becomes the starting point for modeling and mapping. As we develop the graph, it often illuminates the structure responsible for performance —it stimulates OPERATIONAL Thinking. We begin to better understand the ecosystem.
HOW Individually Draw two axes. The horizontal will be time. Think about the issue and decide on the most useful time horizon to analyze. How far back does the issue go? How far into the future should we care about it? Put the starting time at the intersection of the axes and the end time at the right end of the horizontal axis.
The vertical axis is the performance measure—your metric or variable of interest. It’s a good idea to normalize this variable (if possible): convert to percentages, averages, or dollars per person, or some other comparable unit.
Draw a dot at the current time. Then, draw a line from the left vertical axis to the dot that represents the current reality. This line can be going up really fast, staying the same, going down super fast, or it could be going up and down in a pattern.
Keep drawing to the right until the final time point. Imagine what the future might look like if we don’t take action. This is the cost of inaction or not solving.
Now, let’s imagine the future. Where would you like this measure to be by the end of the time horizon? What’s the best possible path to get there?
Small Groups
Form small groups (3-5 people) and have each person present their performance framing graph. No discussion or talking of any kind. After everyone shares their graphs, the group should discuss and try to create one graph that they think best explains the issue.
Large Groups
Each group shares their graphs in a large group using the same no talking rule. After everyone’s presented, see if the large group can create 1-3 graphs that they think really capture the essence of the issue. It’s best if there are a few graphs that cover very different aspects of the issue (e.g operations, finances, human resources.)
Additional Resources
Books
Book title as link | Description
Articles
Article title as link | Description
Online Resources
Resource title as link | Description
Tools
🛠️ Ecosystem Strategy Mapping — Building the Road to High Performan
TOOLS
Attribute of Tools
Lorem ipsum dolor sit amet, consectetur adipiscing elit, sed do eiusmod tempor incididunt ut labore et dolore magna aliqua
About
Overview of the attribute. Lorem ipsum dolor sit amet, consectetur adipiscing elit, sed do eiusmod tempor incididunt ut labore et dolore magna aliqua. Ut enim ad minim veniam, quis nostrud exercitation ullamco laboris nisi ut aliquip ex ea commodo consequat. Duis aute irure dolor in reprehenderit in voluptate velit esse cillum dolore eu fugiat nulla pariatur. Excepteur sint occaecat cupidatat non proident, sunt in culpa qui officia deserunt mollit anim id est laborum.
“Where the world is dynamic, evolving, and interconnected, we tend to make decisions using mental models that are static, narrow, and reductionist." — John Sterman
The claims department of a Fortune 100 financial services company faced several critical challenges. Staff turnover had reached unprecedented levels, with remaining employees exhausted and emotionally drained by an escalating volume of customer claims. The increasing complexity of these claims necessitated more time, particularly with emotionally charged customers, yet hiring efforts proved ineffective in addressing the persistent understaffing problem. The impending retirement of key senior leaders further exacerbated concerns.
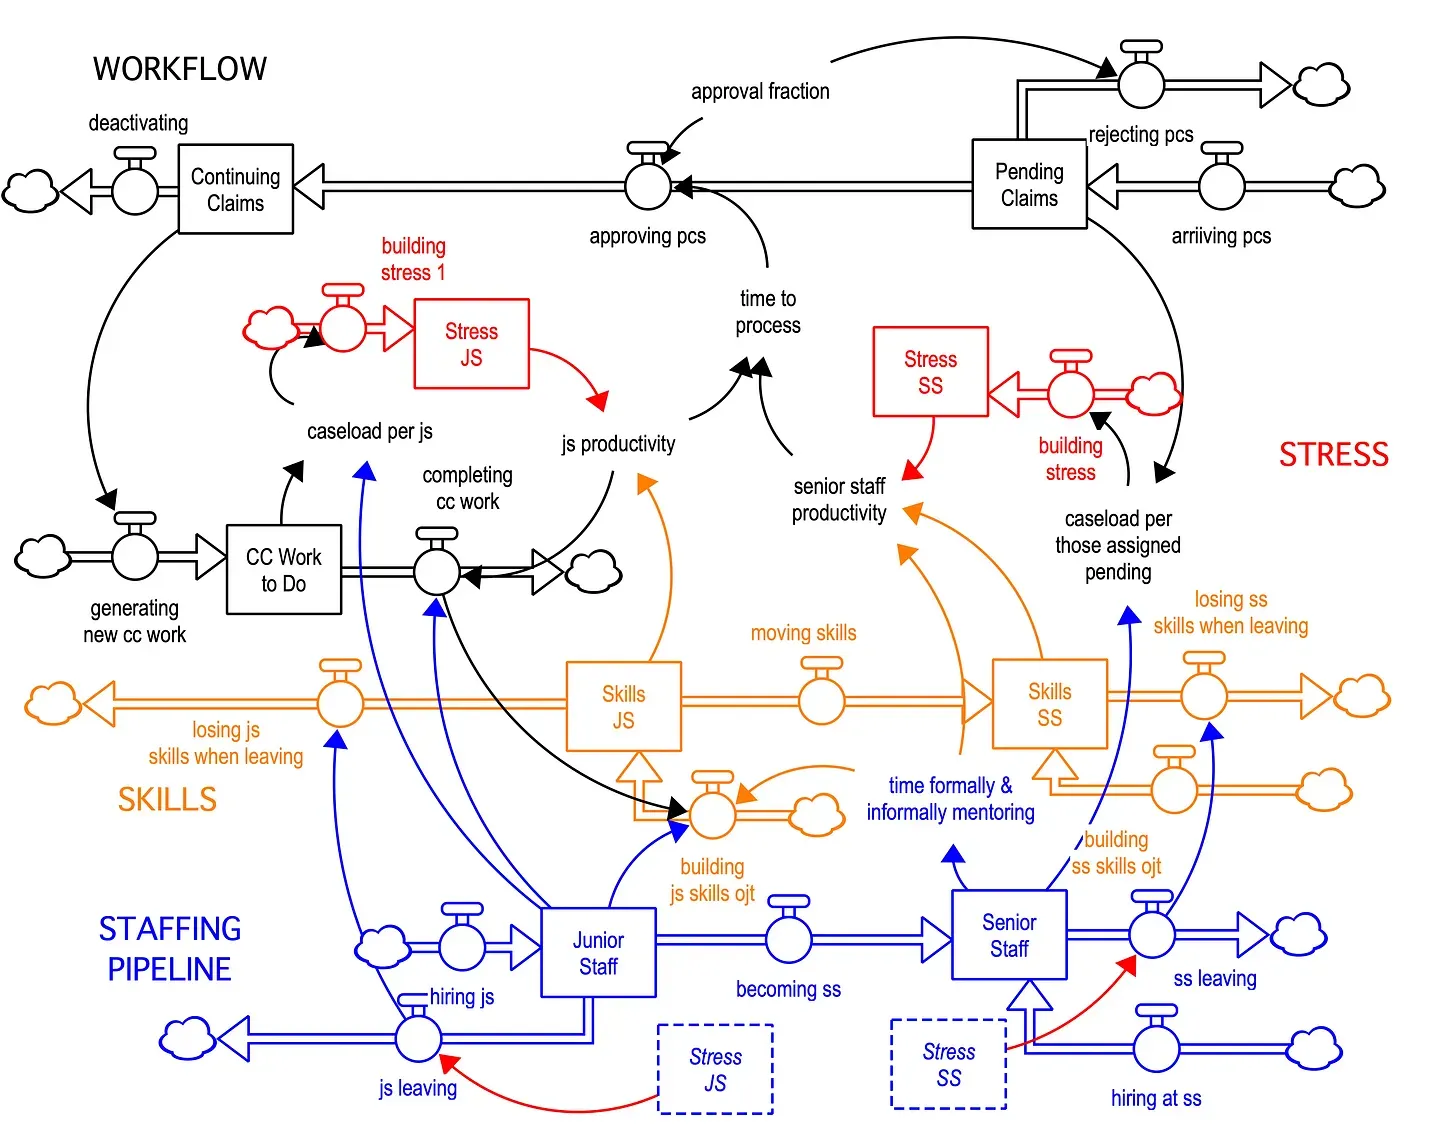
A team of executives, managers, and subject matter experts strengthened and applied systemic intelligence (SysQ) to address this complex, dynamic challenge. The team embarked on a SysQ mapping and modeling process. The learning journey’s objective: identify systemic causes of chronic turnover and claims errors and develop effective strategies to improve these workforce dynamics. Through the SysQ Process, they explored the structural reasons for their difficulties in attracting, developing, and retaining a capable workforce.
The cross-functional team developed a comprehensive theory of the claims process — encompassing workflow, staffing, skills, and stress. The resulting ecosystem strategy map improved and integrated existing mental models across the organization; it provided a comprehensive and balcony-level view of the claims process. By applying SysQ Thinking Skills, they significantly refined this working theory of how the claims ecosystem generated processing errors and staff turnover.
A key discovery was the pivotal role of emotional intelligence (EQ) — or lack of it — played in the workforce dynamics. Building EQ was particularly essential for senior staff — it improved the mentoring of more junior staff. High EQ proved essential for both skill development and stress management. Mentoring was needed to facilitate staff learning and increase productivity.
However, the knee-jerk response to turnover — increasing the hiring rate— inadvertently exacerbated the situation. Too many new staff overwhelmed senior leaders’ ability to keep up with mentoring; this slowed the rate of learning by junior staff, thus lowering overall productivity and driving up the workload per staff member. This led to additional stress. And stress further compounded the issue, leading to decreased productivity, increased attrition, and costly errors. This created a nasty reinforcing feedback loop — a vicious cycle.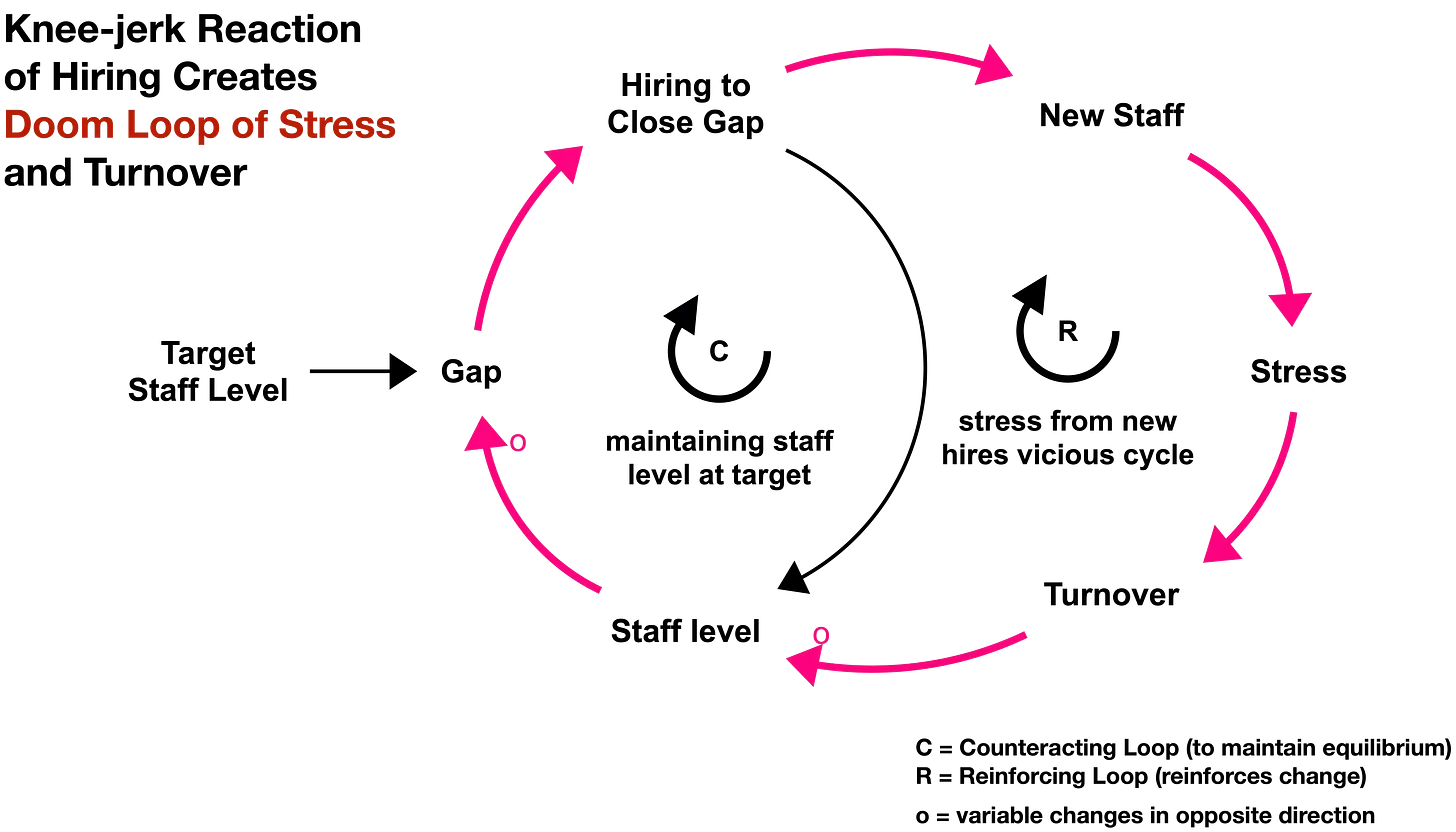
The comprehensive mapping process underscored the importance of balancing workloads and mentoring in fostering a supportive work environment and enhancing staff effectiveness. Notably, it revealed that the prevalent practice ofrapidly hiring when attrition rates increase actually exacerbates burnout and attrition.
The collaborative mapping process emphasized the significance of proactive measures to address workforce challenges. By providing emotional intelligence training to senior staff to enhance mentoring, implementing stress management training for all employees, and optimizing processes, the company successfully managed stress, reduced decision times, and minimized error rates in claims processing. These interventions led to a more resilient and nimble team, capable of meeting the evolving business demands in a complex environment.
TRADITIONAL PROBLEM-SOLVING APPROACHES ARE INADEQUATE, INEFFECTIVE, AND OFTEN MAKE THINGS WORSE
In today’s interconnected world, organizations encounter increasingly intricate challenges that defy simplistic solutions. For instance, corporations striving to maintain market dominance, government agencies grappling with public health and well-being concerns, and non-profits working to combat poverty all face a common reality: traditional problem-solving approaches are inadequate.
Many organizations adopt a “mechanical mindset,” viewing issues as isolated events to be resolved with straightforward solutions. This approach is effective for routine problems with clear cause-and-effect relationships and established solutions. However, today’s most pressing organizational challenges are adaptive and complex, resisting simple solutions.
As John Sterman (Jay W. Forrester Professor of Management at the MIT Sloan School) states in Public Health Matters, “Where the world is dynamic, evolving, and interconnected, we tend to make decisions using mental models that are static, narrow, and reductionist. Among the elements of dynamic complexity people find most problematic are feedback, time delays, and stocks and flows.”1
Systemic Intelligence (SysQ) provides a powerful framework for comprehending and addressing the most challenging, perplexing, and intractable organizational issues.
The SysQ Process, when rigorously applied with the SysQ mindset, skills, and tools, enables the identification of deeper patterns and relationships that drive organizational behavior. Mental models developed with SysQ include Sterman’s feedback, time delays, and stocks and flows. Understanding the drivers of ecosystem dynamics is crucial for developing actionable and transformative strategies. One of the most effective ways to grasp these drivers is by creating an ecosystem strategy map, just like the claims processing department developed.
HUNTSVILLE’S ECOSYSTEM STRATEGY MAP POWERED ECONOMIC GROWTH
A recent headline by WBHM — NPR News for the Heart of Alabama — highlights the impact of a community-wide ecosystem strategy mapping effort.
Mississippi wants more tech jobs. Here’s what it can learn from Alabama’s tech success
“The Huntsville/Madison County Chamber of Commerce said about 15 years ago it had that same problem with retention. Companies were drawing in young talent from across the country for internships and entry levels programs, but they would leave for bigger cities.
The reason? They were bored.
So the city and chamber worked to find out what would entertain and stimulate young tech talent and bring in those features. Huntsville now has an outdoor shopping mall with restaurants, a minor league baseball team, a food truck festival and an ice-skating rink in the winter. Lucia Cape, the head of economic development at the Huntsville/Madison County Chamber of Commerce, said the efforts to improve the city’s quality of life worked and led to more talent sticking around.
‘The soft stuff is almost harder because you can’t just put money on it and contract it out,’ Cape said. ‘You have to be responsive and it has to be, you know, genuine.’
O’Mara agrees that quality of life is essential for keeping and attracting the talent needed to spur innovation.
‘Part of what made Silicon Valley and other places thrive is not just investment in tech or engineering,’ O’Mara said. But investment in social infrastructure, having strong public schools, having thriving neighborhoods.’”
The Chamber of Commerce identified the “soft stuff” by first developing an ecosystem strategy map. During the mapping process, the cross-sectoral team came to an uncomfortable realization: their current tech strategy of importing more senior-level STEM professionals was actually discouraging recent college graduates from staying in Huntsville.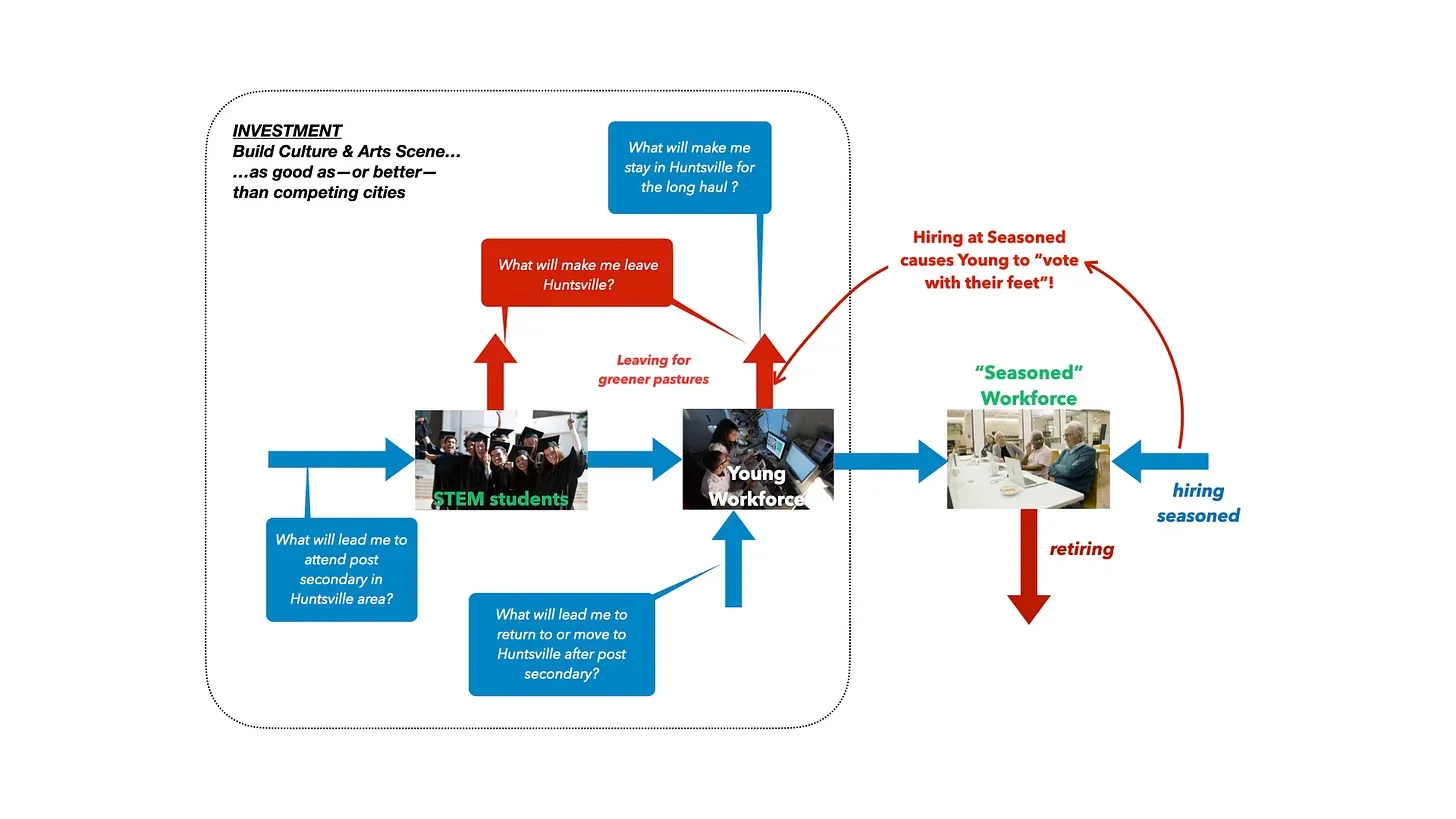
Instead, the map revealed that by building a community with a strong arts and culture scene — attributes that coastal tech centers possessed more readily than Huntsville — they could attract, retain, and nurture young STEM professionals. This approach created a more sustainable tech hub. Consequently, Huntsville became one of the most attractive communities in the US, as recognized by US News & World Report.
A more complete map is below.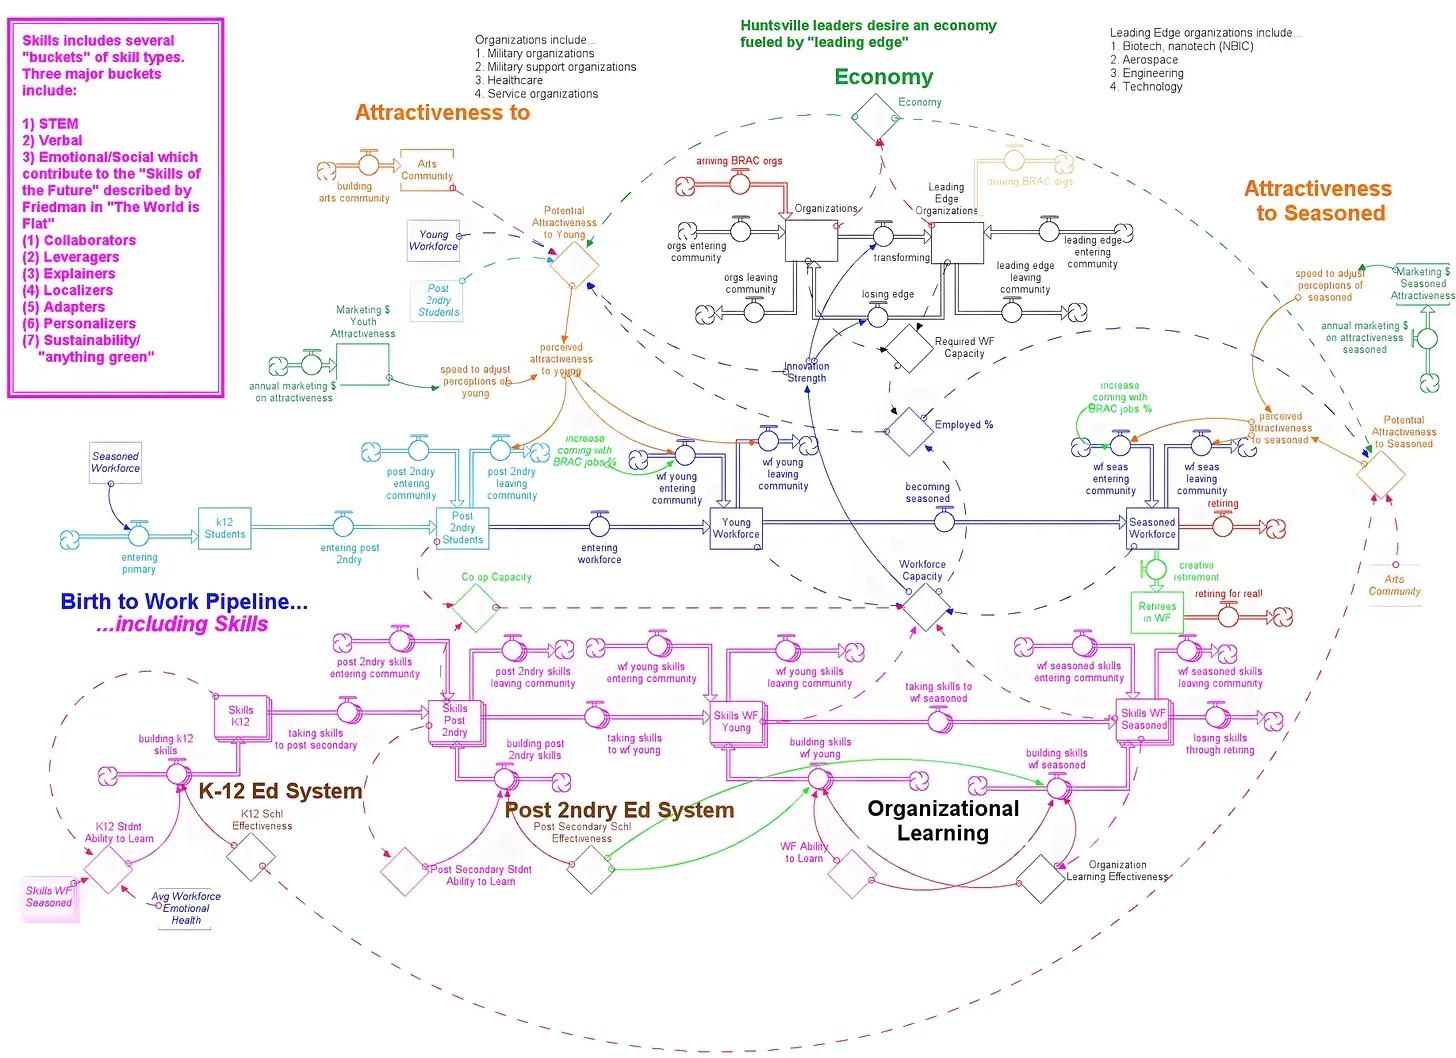
MOVING TO A HIGHER PERFORMANCE ORBITAL
Perhaps the most adaptive challenge an organization can attempt is the desire to transition from less than optimal performance to a level of high performance, akin to reaching a high-performance orbital. Organizations, communities, and nations perform at varying levels in terms of their collective health and well-being. Some organizations consistently innovate and sustain growth; others stagnate or even face setbacks, leading to their demise. Although this analysis applies equally well to communities and countries, let’s now focus on organizations.
Every organization has a current level of performance aligned with its mission. This encompasses various aspects, such as:
Aligning with the organization’s purpose — How effectively is the organization achieving its intended goals?
Customer service — Are customers experiencing exceptional service or subpar experiences?
Growth and expansion — Is the organization growing and increasing its reach and influence, or is it stagnant?
Employee well-being — Are employees fulfilled and nurtured, or are they miserable?
Overall impact — Is the organization nurturing people, creating public value, and generating a profit?
Consider an organization that is currently functioning at a suboptimal level. While it may not be performing abysmally, everyone agrees that there is substantial room for improvement. Customers and employees could experience greater satisfaction, and the organization could have a more significant global impact. Such an organization is stuck in a lower performance orbital. To achieve greater success, leadership aims to lift the organization’s performance to a higher level. They might establish a desired performance standard, which serves as a vision of an ideal future, by setting a BHAG. A BHAG stands for a Big Hairy Audacious Goal, and it was first introduced in the book Built to Last: Successful Habits of Visionary Companies by James Collins and Jerry Porras.2 Collins and Porras urged organizations to set their BHAG as a long-term objective to fundamentally alter the very essence of a business’s existence. Huntsville’s BHAG was to become the most thriving tech hub in the United States.
An organization or community becomes trapped in a lower performance trajectory due to the way it organizes and deploys its resources — where and how it allocates attention and assets. The organization’s organizational structure, resource allocation practices, rules, policies, strategies, and norms and culture all stem from leadership’s and employees’ mental models about the organization and the environment (ecosystem) it operates in.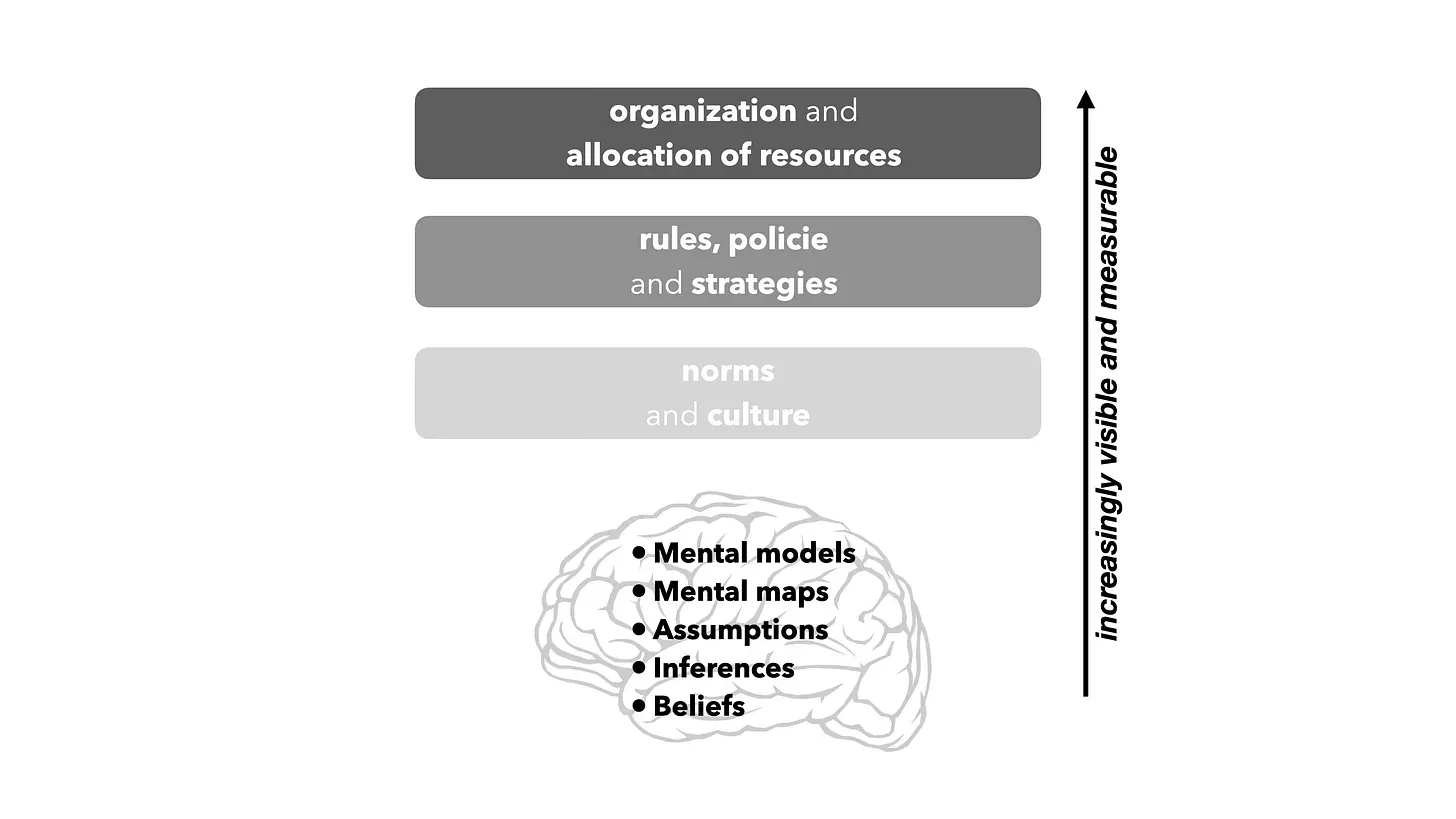
Leadership and staff develop a strong attachment to “the way it is,” which solidifies the strategy and culture. Individuals become ensnared by their mental models. The only path to elevating the organization to a higher performance trajectory is to challenge and transform those mental models. SysQ is the capacity required to facilitate this transformation — it promotes what is known as Double-loop Learning. Both the financial services company and the Huntsville metropolitan region underwent a remarkable transformation precisely by using ecosystem strategy maps to Double-loop the problem.
A FAILURE TO QUESTION MENTAL MODELS
Early in the 1990s, I worked as an OD consultant for the Bureau of Engraving and Printing (BEP), a government agency responsible for currency production. At that time, the BEP also handled the printing of postage stamps. BEP stamps were renowned for their artistic quality and had garnered immense admiration from the numismatic community for over a century. This artistic approach and meticulous attention to detail were a source of pride for the engravers and printers at the BEP.
However, during my tenure, some for-profit printing companies began producing lower-grade (less appealing to collectors) stamps with a unique feature: self-adhesion. The prevailing leadership mental model — and those responsible for engraving and printing — was self-adhesive stamps would have limited demand due to their inferior visual quality.
On June 10, 2005, less than a decade after leaving to work for a system dynamics consultancy, I discovered that the BEP had printed its last stamp. Self-adhesive stamps had become the industry standard, and the preference for the aesthetically pleasing but inconvenient work-of-art stamps diminished in favor of the practical self-adhesive option. The public not only hated the inconvenience of licking stamps, they hated the taste!
Ironically, the BEP had been the pioneering organization to test self-adhesive stamp printing in the 1970s. However, leadership had made the decision not to market them due to the prevailing mental model that undervalued the potential of self-adhesive stamps.
This phenomenon is not unique to the BEP. Numerous other organizations have had great ideas but failed to pursue them because of their collective mental models that undervalued the potential of those ideas. For instance, Apple products are filled with innovative ideas that originated from Xerox, but these ideas were never fully implemented because Xerox’s mental model positioned it as a printing company rather than a computer company. Another ironic twist is that Xerox itself emerged from IBM innovations that were never marketed because IBM’s identity was as a computer company rather than a printing company.
MONEYBALL — CHALLENGING AND CHANGING ASSUMPTIONS
In the 1970s, the Oakland A’s found themselves in a dire situation, struggling to climb out of the basement of the American League West division. Their financial constraints made it impossible for them to compete with teams like the New York Yankees, who could afford to acquire the best players in the major leagues, including all-stars. Despite their best efforts, the A’s were unable to rise near the top of their division, let alone reach the league championship series.
The story of Billy Beane, the A’s general manager, and his team was brilliantly portrayed in Michael Lewis’s book, Moneyball: The Art of Winning an Unfair Game. Wikipedia provides a comprehensive account of Billy and his team’s journey.
“The central premise of Moneyball is that the collective wisdom of baseball insiders (including players, managers, coaches, scouts, and the front office) over the past century is outdated, subjective, and often flawed, and that the statistics traditionally used to gauge players, such as stolen bases, runs batted in, and batting average, are relics of a 19th-century view of the game. Sabermetrics and statistical analysis had demonstrated, for example, that on-base percentage and slugging percentage are better measures of batting. The Oakland A's began seeking players who were "undervalued in the market” — that is, who were receiving lower salaries relative to their ability to contribute to winning, as measured by these advanced statistics.
By re-evaluating their strategy in this way, the 2002 Athletics, with a budget of $44 million for player salaries, were competitive with larger-market teams such as the New York Yankees, whose payroll exceeded $125 million that season. The approach brought the A's to the playoffs in 2002 and 2003.”3
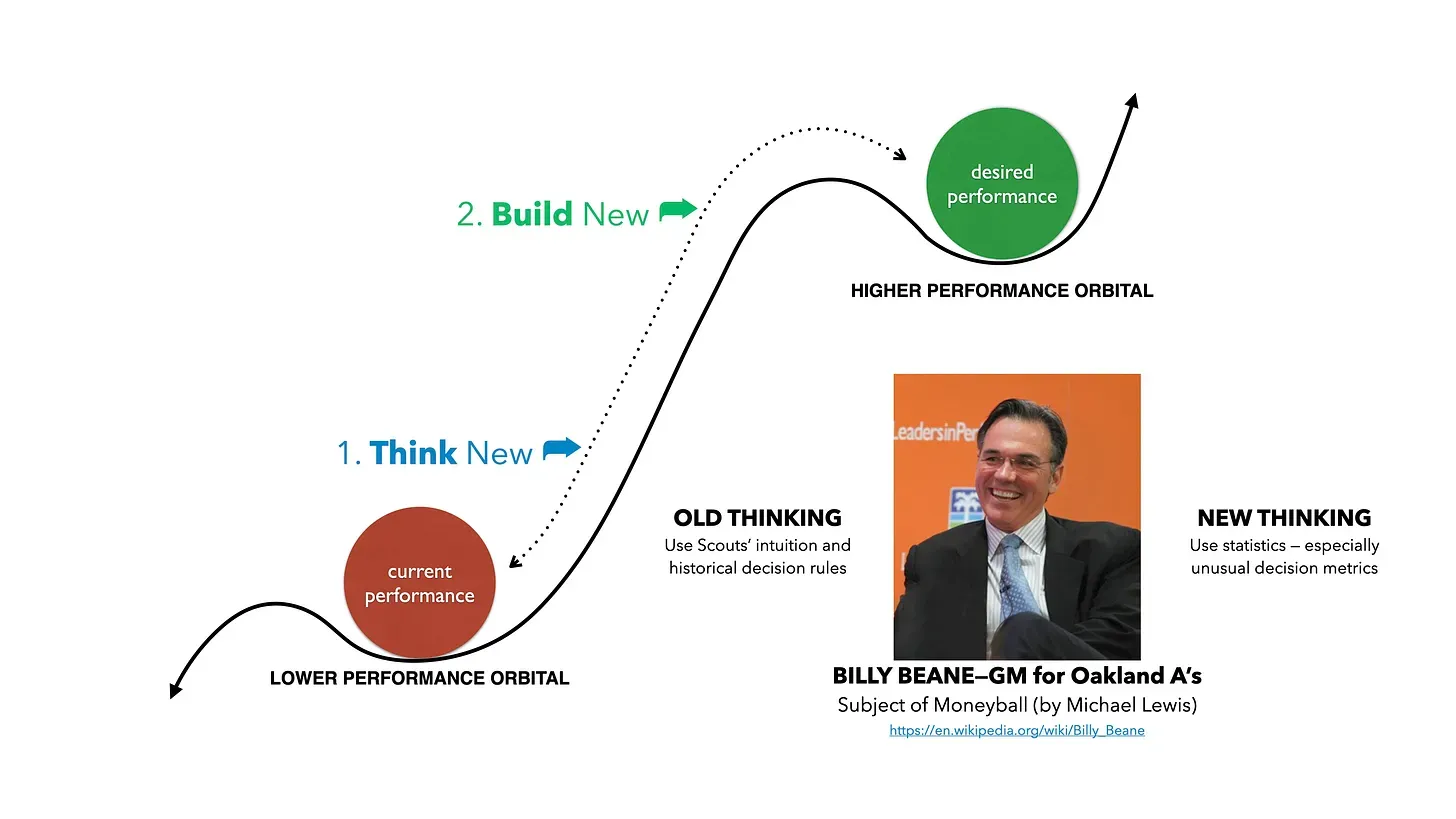 Billy Beane’s success in making the A’s competitive is an example of Double-loop Learning, a concept developed by Chris Argyris. By challenging and altering conventional assumptions about what constitutes high-valued baseball players, Billy Double-looped the problem of poor performance.
DOUBLE-LOOP LEARNING — WHY IT’S CRUCIAL TO ACHIEVING HIGHER PERFORMANCE When confronted with problems, issues, and challenges, we become motivated to address them. We recognize the gap between our aspirations and our current reality; the gap motivates us to analysis and action. In the face of such a gap, we must devise a plan, make a decision, or develop a strategic approach.
The strategy we construct doesn’t come from the ether; it’s a product of our mental models of reality. M. Scott Peck aptly describes these models as our mental maps of the world. These mental models represent the causal assumptionswe employ to make sense of — to understand — how the universe works. They must include our assumptions about the underlying causes of the problem: without a clear understanding of the causes, we are unable to develop an effective strategy.
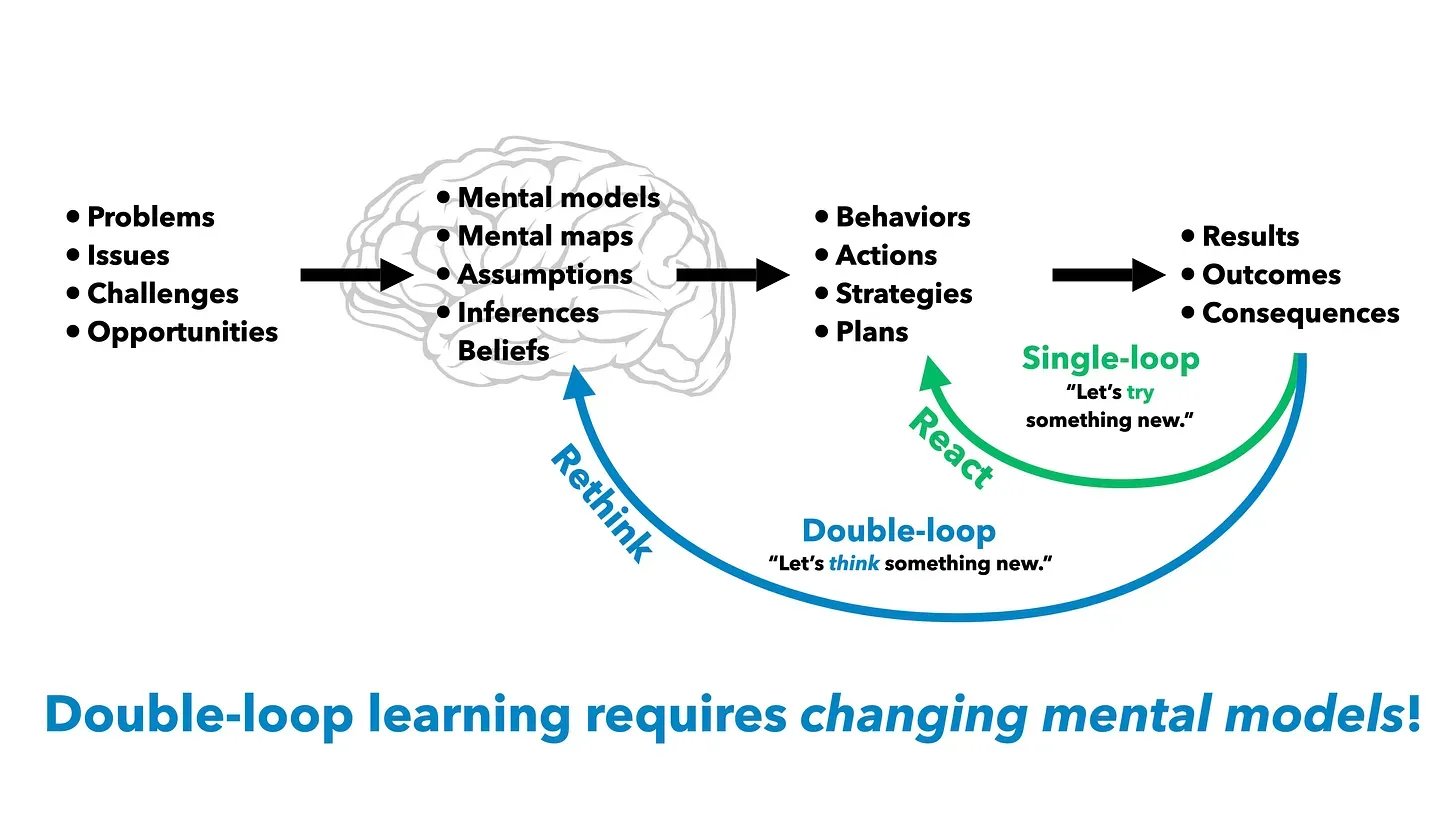 Therefore, we run problems through our existing mental models of those challenges (second column from the left in the diagram). By drawing upon our assumptions about the causes of the issue, we determine the most suitable plan or strategy. Subsequently, we execute this strategy, taking concrete actions (the second column from the right in the diagram).
Our actions and behaviors lead to tangible results, outcomes, and consequences (the far right column). If we have the right strategy and execute it effectively, the outcome will be positive: we successfully resolve the issue and narrow the gap between our aspirations and reality.
The diagram and accompanying text provided in Conversational Capacity by Craig Weber offers further insights into this process.
“Obviously, proactive double-loop learning is the preferable option, and getting people with differing and conflicting views to lean into their differences is essential. ‘If people don’t engage across the divide of their differences, there is no learning,’ says Ron Heifetz.’ People don’t learn by looking in the mirror. They learn by talking with people who have different points of view.’”4
They learn by collaborating with others to identify, challenge, and modify their mental models. However, one challenge is that it can be difficult to recognize our own mental models. They become like the water we swim in; when asked about our mental maps, we might respond, “What water?” This is why ecosystem strategy mapping — surfacing and challenging our mental models — is a valuable tool.
WE MUST RETHINK…NOT REACT
As the previous diagram illustrates, our typical response to a challenge is to react. We don’t question our understanding of the world; we simply continue as if we know the exact cause of the issue. We modify our strategy only slightly. For instance, if sales still decline despite reducing prices, we might lower the price further. In many cases, lowering prices can boost sales in the short term; however, this strategy can also lead to long-term sales declines if our capacity is insufficient to meet the increased demand, resulting in lower customer satisfaction.
This type of strategy adjustment — tweaking around the margins without questioning our mental models — is what Chris Argyris labeled Single-loop Learning. Single-loop Learning is our default mode of operation. It serves us well in many situations — for example, when we feel our hand burning, we know it’s from the stove we’ve placed it on, so we simply remove the hand.
However, Single-loop Learning — although efficient because it requires minimal inquiry and reflection — is often insufficient to solve problems or develop strategies in the face of adaptive challenges. Adaptive challenges, by definition, defy routine problem-solving. We don’t truly understand what creates those challenges, so how can we effectively solve for them?
THE FINANCIAL SERVICES COMPANY DOUBLE-LOOPED THE PROBLEM
This is where it’s crucial to reevaluate our mental models: we need to adopt a Double-loop approach to problem-solving.
Double-loop Learning involves first ceasing our reactive behavior and then initiating reflective thinking. We must examine, challenge, and change our assumptions about the issues and the cherished beliefs we hold dear that hinder their resolution. We identify the gaps between our mental models and the real world; if those gaps are incorporated, our mental models would become more congruent with reality.
A more pertinent question arises: what are our misconceptions about the causes of the challenge that are simply incorrect? These misguided beliefs might inadvertently exacerbate the problem.
For instance, the financial service company’s impulsive decision to hire more employees actually worsened the situation — contributing to a more rapid turnover rate and heightened workplace stress.
ECOSYSTEM MAPS — BUILT WITH SYSQ — ILLUMINATE AND TRANSFORM OUR MENTAL MODELS
The financial services team and their extended organizational partners developed actionable insights by creating the claims ecosystem map. A less-than-obvious truth of the SysQ Process is that actionable insights aren’t generated in a single, two-hour meeting filled with PowerPoint slides. Instead, insight — Double-loop Learning — requires an extended process involving multiple meetings where a team or coalition collaboratively builds a map (and often utilizes other SysQ Tools). Such meetings require effort, can be emotionally charged as the team challenges their understanding of reality, and work best if spaced out enough to provide ample individual reflection.
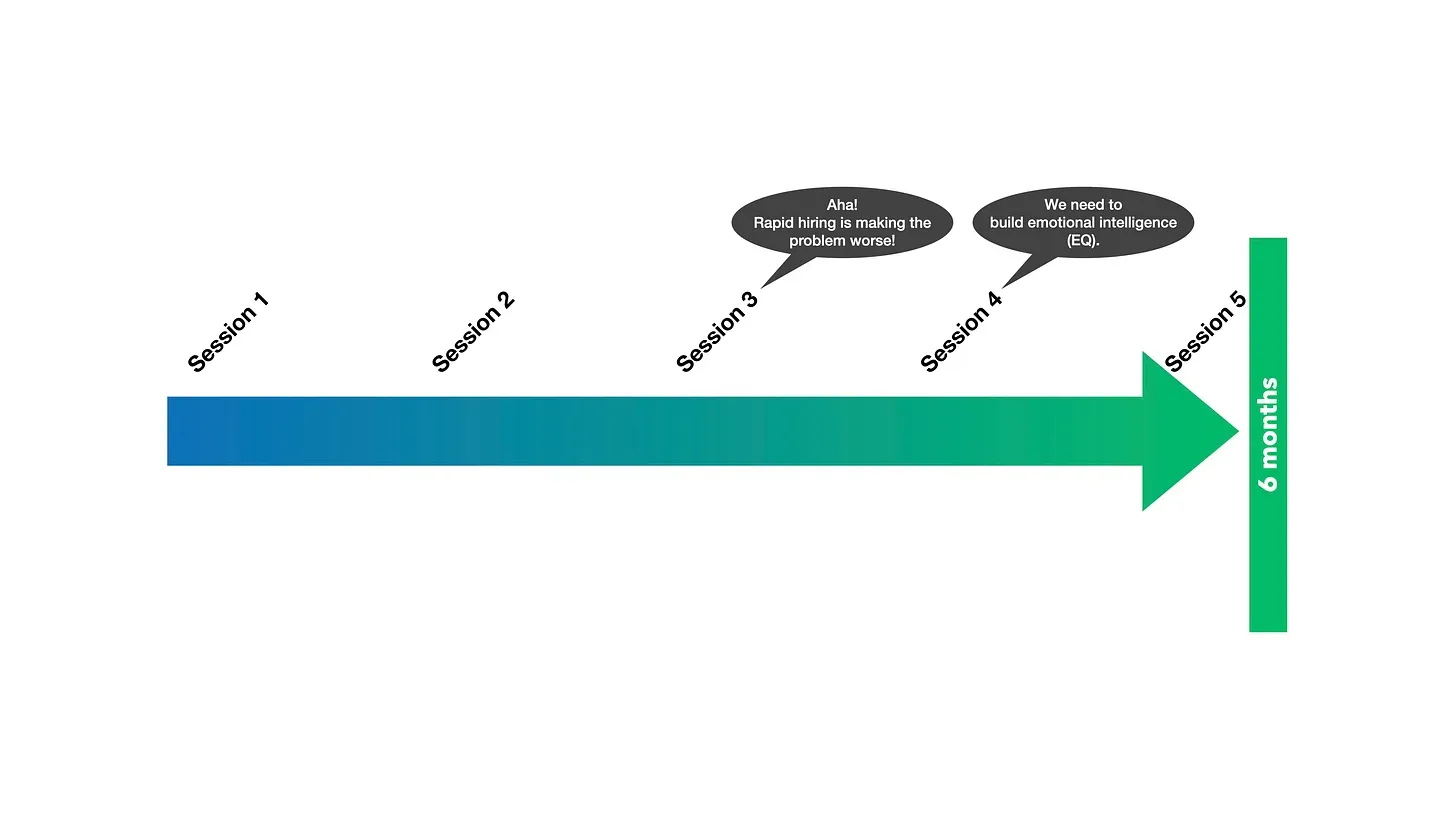 In the claims process, it was during the third of five half-day sessions that the mapping team had an “Aha moment” they realized their initial hiring strategy was exacerbating the problem. It took another session before they also identified the need to incorporate emotional intelligence as a crucial aspect of the workforce strategy.
Similarly, it took several mapping sessions for the Huntsville coalition to recognize that their strategy of importing seasoned STEM professionals was hindering their ability to attract and retain the workforce of the future. They also identified the “soft stuff” they needed to implement, such as creating a vibrant arts and culture scene.
Neither the financial services company nor the community coalition would have achieved Double-loop insights in a single hour PowerPoint presentation from external experts. The team would likely have dismissed external experts by claiming they lacked understanding of the organization’s or community’s dynamics.
Double-loop Learning occurs during collaboration. It requires surfacing, exchanging, questioning, transforming, and integrating mental models. It’s impossible to achieve Double-loop learning simply by wishing for it within the confines of a single session. There’s no “watch me wave my wand and poof…the magic happens” that will occur. Attempting to generate insight in a single session leads to getting stuck on a Single-loop hamster wheel.
‘A slow sort of country!’ said the Queen. ‘Now, here, you see, it takes all the running you can do, to keep in the same place.
If you want to get somewhere else, you must run at least twice as fast as that!’
— Lewis Carroll, Alice in Wonderland
I’m sure you can relate to feeling like your organization, coalition, or clients are stuck on a hamster wheel, as if you’re Alice in Wonderland running faster and faster to stay in the same place.
Double-loop learning is essential to stepping off the hamster wheel. SysQ and an Ecosystem Strategy Mapping Process can facilitate Double-loop learning — lifting an organization or community to a higher performance orbital.
BUILDING ECOSYSTEM STRATEGY MAPS FACILITATE DOUBLE-LOOP LEARNING
Elevating to a higher performance orbital system requires collaboration and dialogue among and across organizational leadership and contributing stakeholders. To guide a successful transformation, it’s crucial for groups across the ecosystem — departments within the organization and partners outside — to comprehend and visualize how the system functions. However, our current understanding often falls short, leading to flawed assumptions that exacerbate our challenges.
Ecosystem mapping is a valuable tool to gain a comprehensive operational view of the system, enabling us to make informed changes and enhance its performance. By applying the SysQ Process and Skills in constructing ecosystem strategy maps, we significantly increase the likelihood of achieving Double-loop Learning.
1
Sterman, John. Learning from evidence in a complex world. Am J Public Health. 2006 Mar;96(3):505-14. doi: 10.2105/AJPH.2005.066043. Epub 2006 Jan 31
2
Collins, J., & Porras, J. I. (1994). Built to last: Successful habits of visionary companies. HarperBusiness.
3
https://en.wikipedia.org/wiki/Moneyball:_The_Art_of_Winning_an_Unfair_Game
4
Weber, Craig, Conversational Capacity: The Secret to Building Successful Teams That Perform When the Pressure Is On
Additional Resources
Books
Book title as link | Description
Articles
Article title as link | Description
Online Resources
Resource title as link | Description
Testimonials
Clients