🧠 SysQ Thinking Skills

Skills
🧠 DYNAMIC Thinking
SKILLS
Attribute of Skills
Lorem ipsum dolor sit amet, consectetur adipiscing elit, sed do eiusmod tempor incididunt ut labore et dolore magna aliqua
About
Overview of the attribute. Lorem ipsum dolor sit amet, consectetur adipiscing elit, sed do eiusmod tempor incididunt ut labore et dolore magna aliqua. Ut enim ad minim veniam, quis nostrud exercitation ullamco laboris nisi ut aliquip ex ea commodo consequat. Duis aute irure dolor in reprehenderit in voluptate velit esse cillum dolore eu fugiat nulla pariatur. Excepteur sint occaecat cupidatat non proident, sunt in culpa qui officia deserunt mollit anim id est laborum.
"We count by years, but we live by days. Rightfully, we should do both by seasons." — Ivan Doig, Dancing at the Rascal Fair
YOU’RE ON A COMPANY’S EXECUTIVE TEAM
Imagine you’re on the senior executive team of a multimillion-dollar company. Last quarter’s financial statement just came out, and it’s a doozy. Your company lost several million dollars. How do you feel?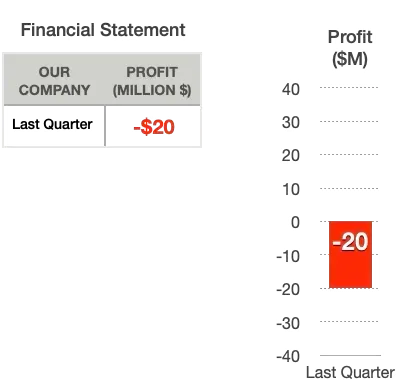 Bad, right? Worried?
What ideas / actions do you think the executive team would discuss and probably implement? If like most companies, you’d consider:
-
Lay offs?
-
Travel restrictions?
-
Training reductions?
-
Several other cost cutting strategies?
Now suppose you were shown the graph drawn below. Profit has plummeted over the past six months. 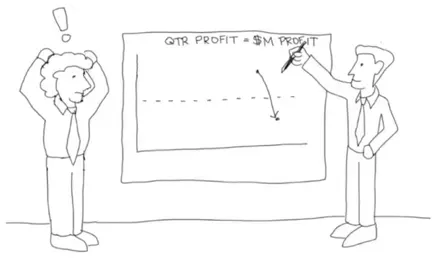
How do you feel now?
Even worse!
Why? Because it looks like things are getting worse–and rapidly!
What ideas or actions do you think the executive team would discuss and likely implement? If you’re like most companies, you might consider:
-
Hiring a consulting firm?
-
Closing part of the business?
-
Ending a product line?
And as an individual on the team you are concerned about a few things. There is probably going to be some personnel changes on the leadership team. The CEO might be let go. The board will certainly be looking for someone to blame.
You? You are most likely improving your resume, contacting friends and colleagues in your network–spending a lot of time on LinkedIn.
Now, suppose you’re shown this graph.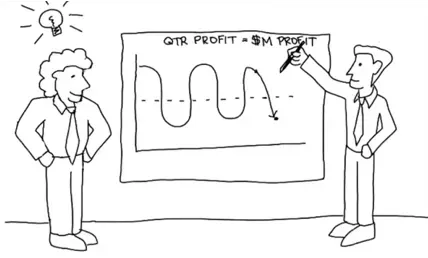 Now how do you feel?
Relieved, right? You may notice even a slight relaxing in the body now (if you were reacting at all to the exercise).
Why relieved?
Because, when viewed over a longer time horizon, the plummeting profits are part of a larger, predictable pattern.
If I asked you what type of business you’re running, you might say it’s a commodity business or more likely a seasonal business (since it has the same fluctuations at the same time each year). Maybe you’re a winter sports chain in New England, selling mostly skis and snowboards.
If it’s a seasonal business (like the winter sports chain) what solutions might you suggest?
You might suggest the following:
Closing the business in the summer months
Diversifying (sell golf clubs!)
Investing during the summer months to boost sales in the winter
Compare the solutions you would propose when analyzing the broader pattern to those you would suggest based solely on quarterly results (an event) or just a half-year’s worth of data (a small window).
The newer solutions are proactive, giving you more control and often revealing opportunities to generate additional revenue. In contrast, the reactive solutions focus on cutting costs.
The key difference between reactive and proactive solutions lies in your understanding of the business’s nature. It’s like seeing the slinky. You grasp the business’s structure, which is seasonal. Once you understand this structure, you can develop a much more effective solution tailored to your business.
EVENT THINKING VS. DYNAMIC THINKING
From a young age, our minds naturally focus on events and behaviors that occur right in front of us, both in space and time. This is not surprising, as humans are hardwired to prioritize the immediate and the present. The ability to hyper-focus on a predator that suddenly leaps from the bushes and react swiftly has proven beneficial to our species. There’s no need to meticulously chart the long-term history of predators leaping from bushes and consuming humans; the immediate response is sufficient: run!
What sets humans apart from other animals is an additional skill: the ability to discern patterns and make predictions. This higher level of consciousness, our meta-level thinking, is essential for addressing adaptive challenges. Our mental models must also include the capacity to represent patterns and make predictions.
In the context of terrorism, it is common in the United States to focus on a single event like 9/11, while overlooking the long history of observable behaviors that could have predicted it. There had been escalating tensions, punctuated by events such as the bombing of the USS Cole and the subsequent US response, as well as actions by the US that supported those considered enemies of terrorist organizations. Adopting a broader, longer-term perspective enhances the quality of any mental model attempting to understand the expansion of terrorism—it helps us identify the causal structures driving it.
Organizations often focus on recent events, such as the last quarter’s profit margin, this week’s layoffs, or current scandals. For instance, the 2008 mortgage crisis in the US (and globally) is a notable example. Initially, in mid-2008, people believed it was a recent phenomenon, likely due to poor management decisions by a few. However, a longer-term perspective reveals that the US economy since the 2000 “sell-off” was stimulated by lower interest rates set by the Federal Reserve. Additionally, granting subprime loans increased at a much faster rate than disposable incomes could sustain. In response, the Federal Reserve resorted to lowering interest rates once again to address the crisis.
The power of an event is undeniable, but unfortunately, we often react impulsively to it. Layoffs, reassignments, extra bureaucratic oversight, and even military invasions are common knee-jerk responses. However, understanding the world and its causes requires the ability to identify patterns of behavior.
REDUCING YOUR STATE’S MEDICAL COSTS
You’re working on your state’s initiative to reverse the rising medical costs. You’ve selected two states to benchmark, and based on their performance, you’ll contact your counterpart in each state to learn from their strategies.
Here are the per capita medical costs for two states. Which one, based solely on this data, would you choose as your benchmark for “best practices”?
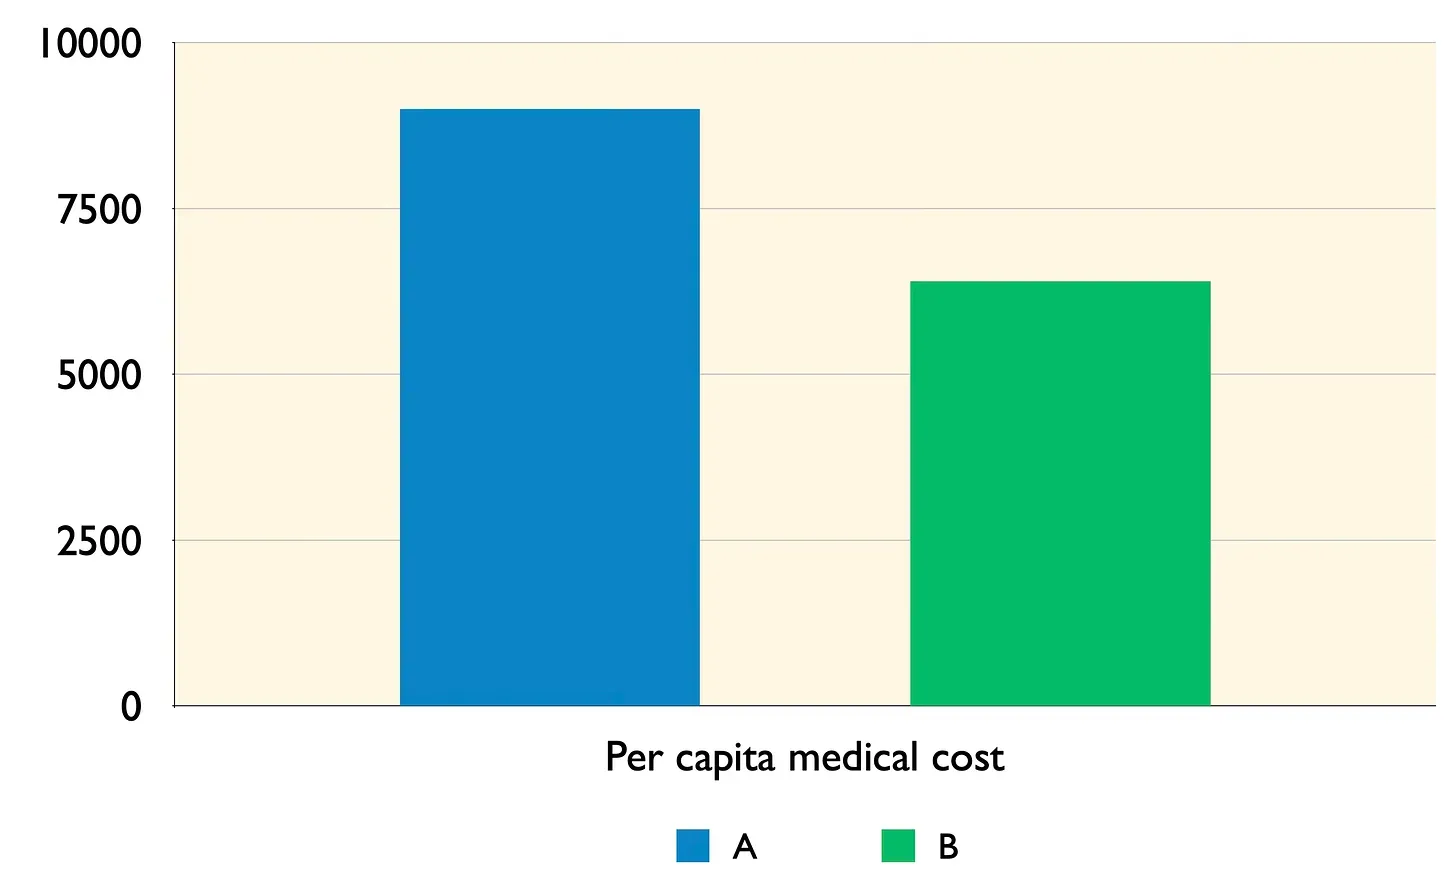
he obvious answer is State B.
However, before you draft an email to your counterpart in State B, your assistant bursts into the room with this chart. Now, which state should you contact to learn from their successful practices?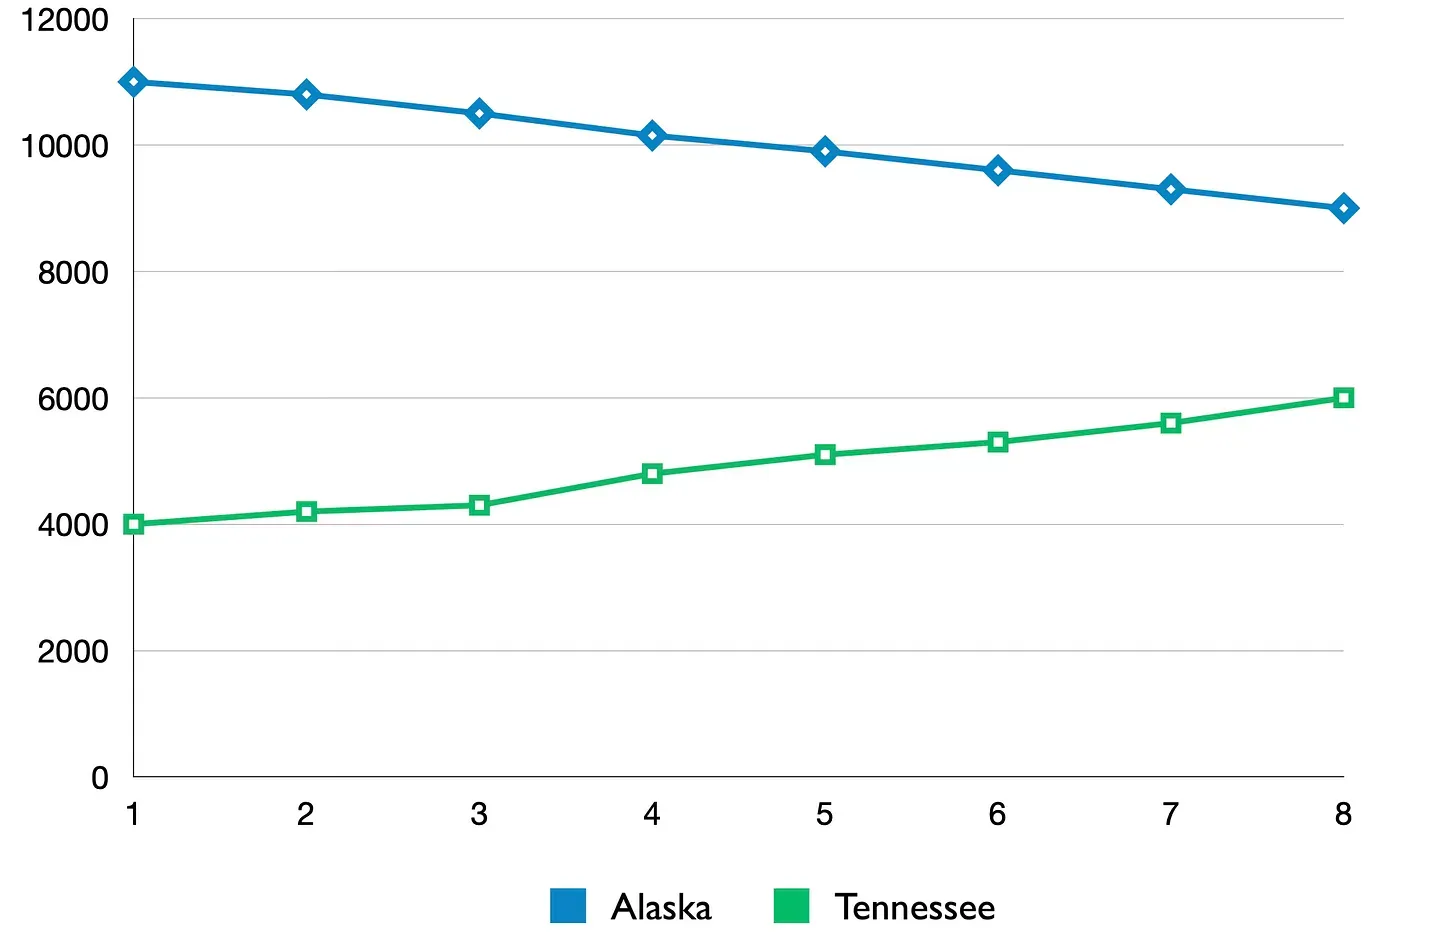
This time the answer is State A.
This illustrates why it’s often beneficial to analyze metrics through the DYNAMIC Thinking lens. First, relying solely on “point in time” data can lead to incorrect conclusions. We frequently make decisions based on narrow time slices of data, which could be detrimental.
Second, comparisons between similar entities, such as states vs. states, cities vs. cities, or countries vs. countries, that only use single numbers can be misleading. Even if two states have the same per capita medical costs, if their trends are similar to those observed here, one may be experiencing rapid deterioration. They are not comparable at all.
Trend lines, on the other hand, often trigger deeper, more rigorous mental models. They provide an operational narrative that enhances our thinking, decisions, and strategies. In this case, observing the trends revealed a story about the direction of performance and clarified the clear winner.
So a good SysQ tenet is:
When something’s important, look at it as a trend over time.
TIME DELAYS: ANOTHER REASON WE NEED DYNAMIC THINKING
In many cases, decisions made today may not have a desired impact on the organization for years. For instance, the Beer Game, a popular learning tool, illustrates our inability to comprehend time delays. Thousands of executives, MBA students, engineers, and others who have played this game have struggled to manage their inventories, even when the retail demand is linear and predictable. Anyone who has played this game understands how inherent time delays in a system’s structure contribute to its performance.
This common limitation also affects our understanding of climate change. John Sterman and Linda Booth-Sweeney have shown that a majority of their subjects (MIT students) cannot predict how long it will take a decrease in carbon emissions rates to impact global climate temperatures, even when the assumptions are clearly stated.1
Ignoring time delays is a major contributor to the planning fallacy. This fallacy occurs when our predictions about the time required to complete a future task are overly optimistic, leading us to underestimate the actual time needed.
Overlooking time delays often results in the common “worse before better” dynamic when implementing public policies or organizational improvements. Public sector managers, rightly so given the public’s understanding of dynamics, avoid policies that may eventually improve situations in the long run but may worsen conditions in the short term.2
THE SHAPE OF A MOVIE
In 2017, we witnessed a plethora of extraordinary yet peculiar movies. Among them, The Shape of Water emerged as the most peculiar of all, potentially claiming the coveted Academy Award for Best Picture.

Its premise, centered around a mute woman named Elisa’s profound love for a creature that resembles a fish more than a human, may initially appear absurd or even laughable. However, this film achieved remarkable success, garnering numerous accolades and captivating audiences.
The trend line for her love of the water man is shown here.
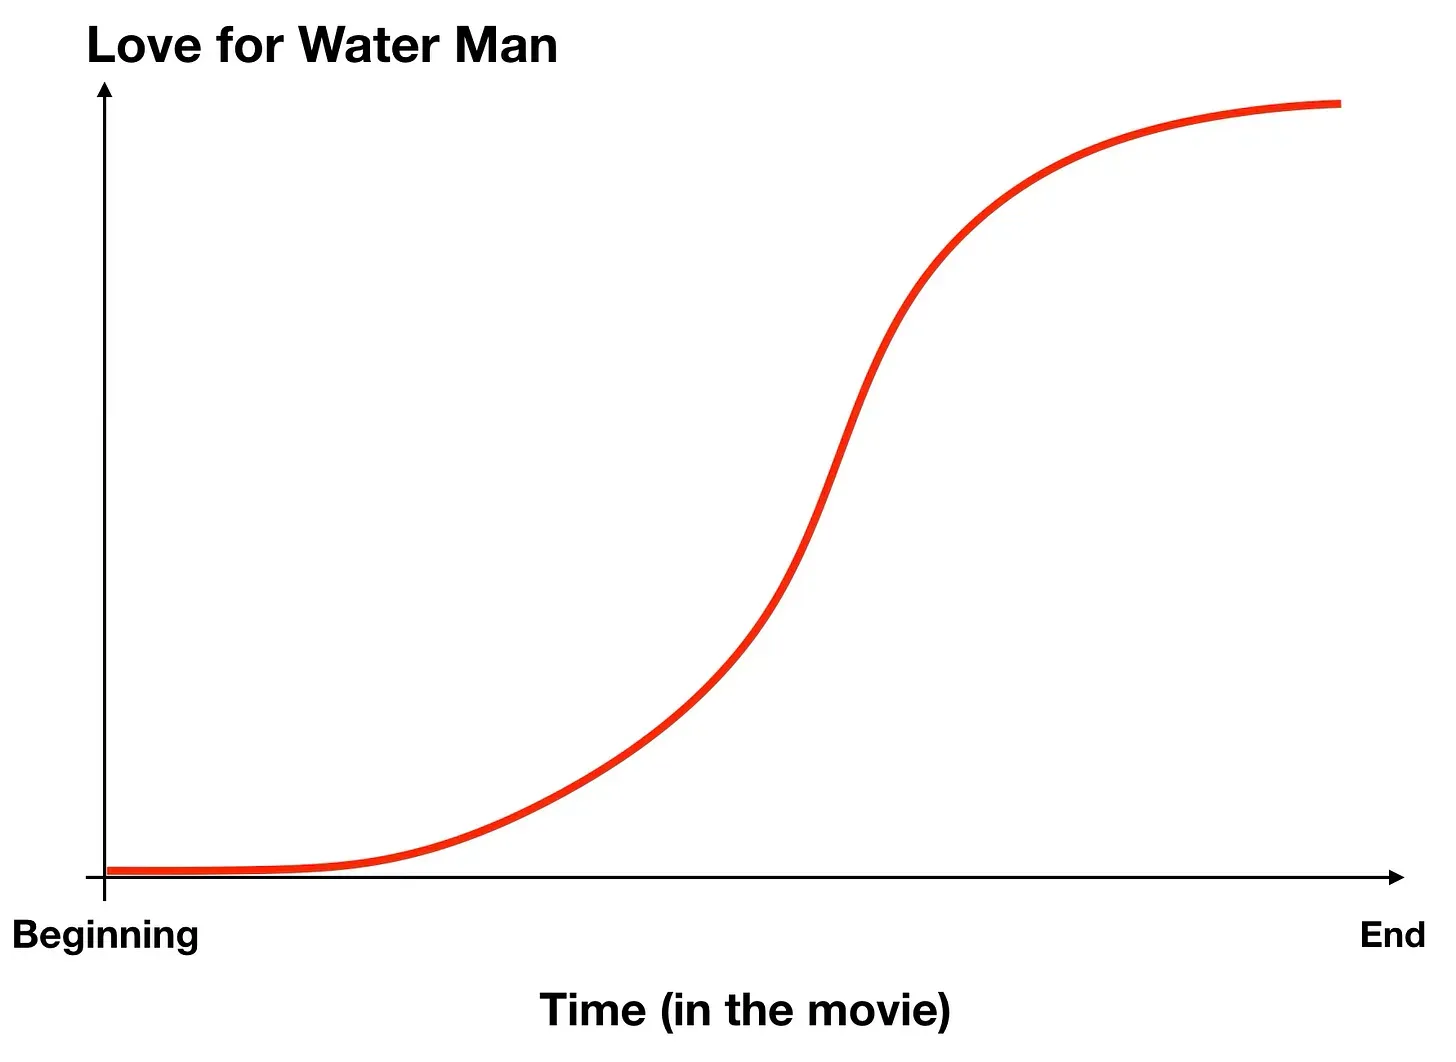
The Shape of Water’s success lies in its ability to gradually reveal credible reasons for Elisa’s growing affection for the water-dwelling entity. This gradual progression allows viewers to comprehend and even predict her actions throughout the movie. If you were to watch only the last third of the film, you might find the scenes so absurd that they would be difficult to take seriously, potentially leading you to leave the theater.
However, by watching the entire movie from the beginning, you are presented with a rational, rigorous, and dynamic mental model that enables you to grasp and even anticipate the protagonist’s actions.
STARTING A SYSQ ANALYSIS? FIND THE PLOT FIRST!
At the outset of every SysQ initiative, establish a clear purpose. Collaborate with your team members and stakeholders who need to be involved. Ensure that everyone is aligned in understanding the purpose of the mapping, modeling, or SysQ analysis.
The purpose is to comprehend the underlying causal factors that contribute to ____________. This knowledge will enable us to develop more effective strategies, policies, or levers to influence ____________ in the future.
While verbal descriptions can suffice, visualizing trends over time through a trend graph can significantly enhance the impact and utility of the analysis, particularly in collaborative settings.
OPERATIONAL THINKING — FOCUSING ON THE PHYSICS — REQUIRES CLARITY ON THE TRENDS
OPERATIONAL Thinking — focusing on the physics — is fundamental to high SysQ and applying it involves gaining a comprehensive understanding of the systemic structure that generates the desired behavior. Clarity on the behavior is not merely a desirable outcome but a prerequisite for effective SysQ application.
The process of clarifying the trends, drawing and agreeing on these trends, aligns everyone on the same page regarding their underlying reasons for working together. It provides a clear vision, fostering strong motivation for collaboration. Therefore, I allocate significant time early in any consulting engagement to assist my clients in achieving vivid and rigorous clarity on the purpose: the trends they intend to influence.
ADDITIONAL BENEFITS OF DRAWING TRENDS OF INTEREST
Gaining clarity on trends helps focus effort and develop a vision of success. But it offers many other benefits as well.
Benefit 1
It automatically shifts collaborators into a generative process. Seeing a trend line prompts the mind to seek understanding. Why does this happen? This prompts us to delve into our mental model database, searching for past experiences that might explain it. We transition from reactive thinking—“How do I react to this?”—to becoming more inquisitive and reflective. We seek causality and explore what generates the behavior or enter a generative process.4
Benefit 2
It helps identify faulty thinking by comparing our perceived trends to what others believe or know. Sometimes, our assumptions are incorrect.
Let’s say I believe that our projects are taking increasingly longer to complete, perhaps because my last two actually did. I might suggest to colleagues we need to invest in some improvement, perhaps upgrade the IT system. Instead of promoting a solution to a nonexistent problem, if I drew a trend line similar to the one shown below, I could share with others, including those who have the data.
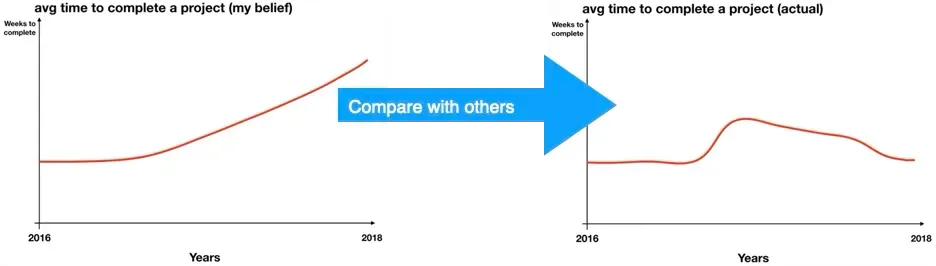
I’d then have the opportunity to learn why my assessment of reality was so far off. Yes, I’d have a learning moment. In this case I’d learn that I was still holding onto the increase in project time that happened late 2016 when several employees left. And even though project times had steadily improved since then, my confirmation bias kept me looking for the trend to go the other way. In this case, I learned something about myself.
I’ve seen the process of drawing trends help legislators who are normally disagreeable with one another become collaborative because they had some inaccurate understanding corrected. If seen engineers show trend lines to management to help them become more concerned about where a staffing issue was likely trending in the not too far future.
Benefit 3
Asking others you wish to be part of the effort to draw trends they are most concerned with–trends that may not be ones you initially used in trying to motivate their involvement–may help you find common ground. It may also help you expand your field of vision.
TO LEARN MORE ABOUT USING TREND GRAPHS
Check out this substack’s resources section to learn about several trend graph types you’ll find useful across a diverse range of purposes and activities.
1
J. Sterman and L. Booth Sweeney, Understanding public complacency about climate change: adults’ mental models of climate change violate conservation of matter, Springer Netherlands, Vol. 80, Numbers 3-4
2
Soderquist, C. Facilitative Modeling: Using Small Models to Generate Big Insights, The Systems Thinker, Pegasus Communications, December, 2003
3
Forbes, 'The Shape Of Water' 4K Blu-ray Review: The Ultimate Wet Dream, Mar 19, 2018, https://www.forbes.com/sites/johnarcher/2018/03/19/the-shape-of-water-4k-blu-ray-review-the-ultimate-wet-dream/
4
Calancie L, Anderson S, Branscomb J, Apostolico AA, Lich KH. Using Behavior Over Time Graphs to Spur Systems Thinking Among Public Health Practitioners. Prev Chronic Dis 2018;15:170254. DOI: http://dx.doi.org/10.5888/pcd15.170254.
The authors used trend graphs with teams in maternal and child health. 86% of participants found the technique improved their thinking and engagement enough to indicate they would use these tools after the workshop.
Additional Resources
Books
Book title as link | Description
Articles
Article title as link | Description
Online Resources
Resource title as link | Description

Skills
🧠 Building SysQ Capacity: Strengthening a Suite of Thinking Skills
SKILLS
Attribute of Skills
Lorem ipsum dolor sit amet, consectetur adipiscing elit, sed do eiusmod tempor incididunt ut labore et dolore magna aliqua
About
Overview of the attribute. Lorem ipsum dolor sit amet, consectetur adipiscing elit, sed do eiusmod tempor incididunt ut labore et dolore magna aliqua. Ut enim ad minim veniam, quis nostrud exercitation ullamco laboris nisi ut aliquip ex ea commodo consequat. Duis aute irure dolor in reprehenderit in voluptate velit esse cillum dolore eu fugiat nulla pariatur. Excepteur sint occaecat cupidatat non proident, sunt in culpa qui officia deserunt mollit anim id est laborum.
"The framework, tools, and language of system dynamics should be accessible to all. Anyone can do this at some level, and everyone should try!" — Barry Richmond
The SysQ Mindset (or Aim) is important, but it’s not enough on its own to create effective and powerful strategies to tackle tough, complex, and chaotic issues. Just saying, “Let’s try to understand the structure causing the problem we want to solve” without coming up with new ways to make sense of the world is like knowing you’re drowning but not knowing how to swim. As Einstein said, “We can’t solve our problems with the same thinking we used when we created them.” Others might say, doing the same things over and over again (with the same thinking) is the definition of insanity.
THE THINKING APPLIED TO THE US COUNTERINSURGENCY STRATEGY
Excerpt From a Famous — Yet Poorly Titled — New York Times Headline
We Have Met the Enemy and He Is Powerpoint
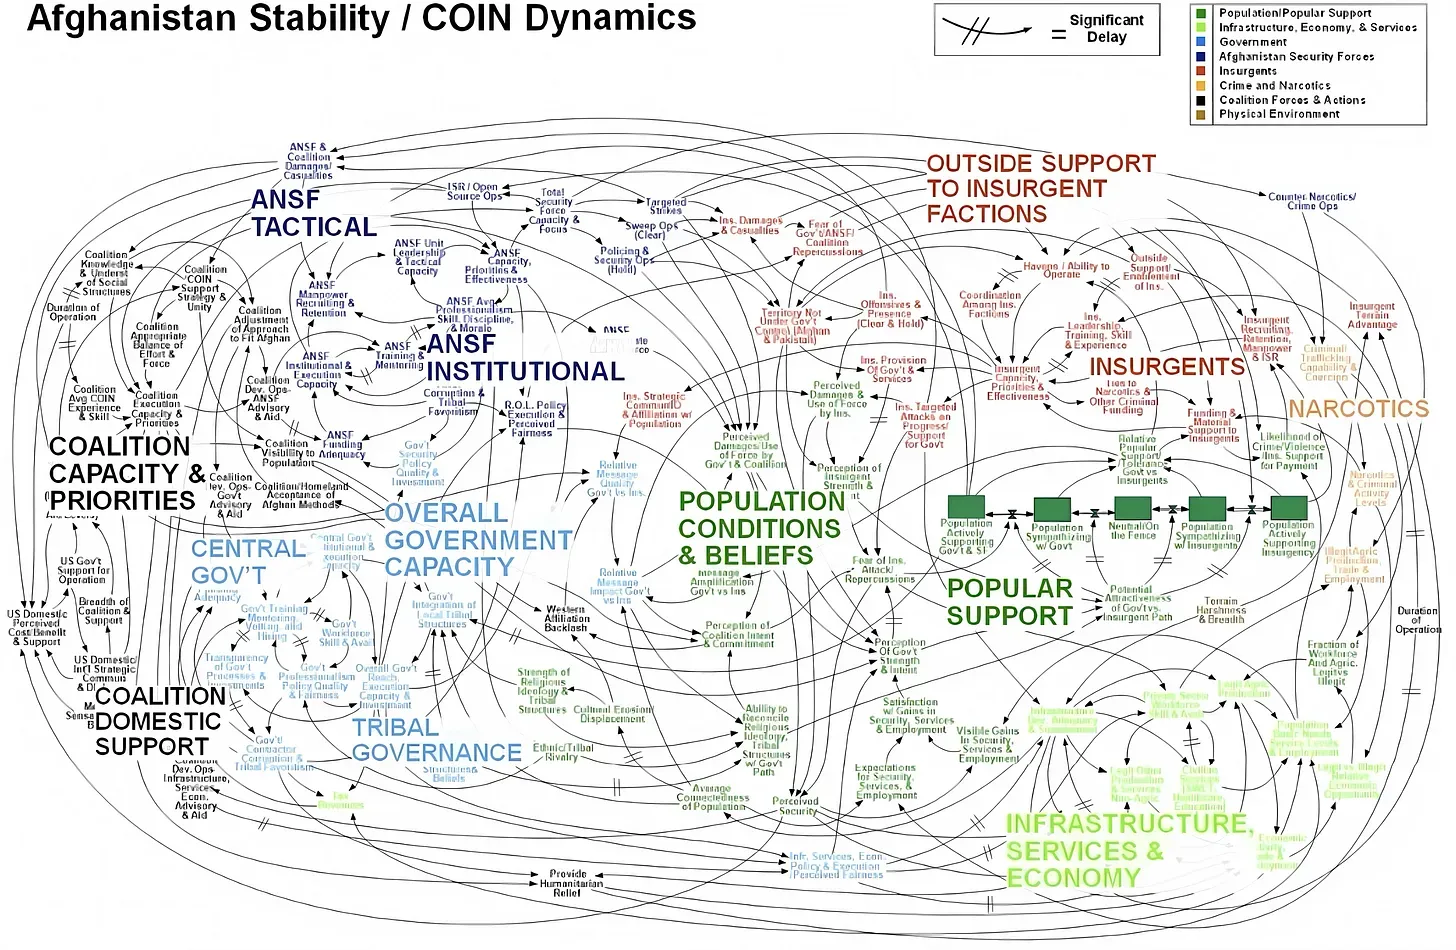
Gen. Stanley A. McChrystal, the leader of American and NATO forces in Afghanistan, was shown a PowerPoint slide in Kabul last summer that was meant to portray the complexity of American military strategy, but looked more like a bowl of spaghetti.
“When we understand that slide, we’ll have won the war,” General McChrystal dryly remarked, one of his advisers recalled, as the room erupted in laughter.
The slide has since bounced around the Internet as an example of a military tool that has spun out of control. Like an insurgency, PowerPoint has crept into the daily lives of military commanders and reached the level of near obsession. The amount of time expended on PowerPoint, the Microsoft presentation program of computer-generated charts, graphs and bullet points, has made it a running joke in the Pentagon and in Iraq and Afghanistan.
“PowerPoint makes us stupid,” Gen. James N. Mattis of the Marine Corps, the Joint Forces commander, said this month at a military conference in North Carolina. (He spoke without PowerPoint.) Brig. Gen. H. R. McMaster, who banned PowerPoint presentations when he led the successful effort to secure the northern Iraqi city of Tal Afar in 2005, followed up at the same conference by likening PowerPoint to an internal threat.
“It’s dangerous because it can create the illusion of understanding and the illusion of control,” General McMaster said in a telephone interview afterward. “Some problems in the world are not bullet-izable.”
In General McMaster’s view, PowerPoint’s worst offense is not a chart like the spaghetti graphic, which was first uncovered by NBC’s Richard Engel, but rigid lists of bullet points (in, say, a presentation on a conflict’s causes) that take no account of interconnected political, economic and ethnic forces. “If you divorce war from all of that, it becomes a targeting exercise,” General McMaster said.
Commanders say that behind all the PowerPoint jokes are serious concerns that the program stifles discussion, critical thinking and thoughtful decision-making. Not least, it ties up junior officers — referred to as PowerPoint Rangers — in the daily preparation of slides, be it for a Joint Staff meeting in Washington or for a platoon leader’s pre-mission combat briefing in a remote pocket of Afghanistan.1
As I mentioned, I think the title of this article is a bit misleading. It’s not really a problem with PowerPoint, although I’ll admit that it can make meetings a bit dull. The issue is with the type of “systems” analysis that’s been done.
While it’s a good attempt to map out the system, it doesn’t follow the basic principles of focusing only on the parts that are responsible for the behavior. It’s like mapping every color in the slinky shown earlier and including all the other details that don’t really matter. When we’re trying to solve complex problems, we need to simplify the process of mapping the structure and use some additional SysQ Thinking Skills.
THINKING SKILLS
To truly apply the mindset of SysQ, we need to think beyond the surface-level behaviors and delve into the underlying structures that drive them. This requires developing some rarely used systemic thinking skills.2 We must shift up from the traditional thinking we apply to problem solving into this higher order thinking. Some types of shifts in thinking include shifting from…
EVENT Thinking — We focus on the latest or most newsworthy event.
➡︎ DYNAMIC Thinking — We shift to seeing how that event is part of a longer term trend. This helps us more clearly see what structural forces might be driving that pattern.
TREE Thinking — We focus individually on each silo in the organization, each department in the division, each sector in society, each country around the world — the equivalent of tree-by-tree thinking.
➡︎ FOREST Thinking — We try to understand how each silo interacts within the organization and even outside it. This interconnected web of departments, divisions, offices, silos, and sectors — the forest — is responsible for larger system behavior.
CORRELATIONAL Thinking — We use regression and correlational analysis to propose causality. Or use anecdotal evidence of when I see this happen something else happens — without a clear and rigorous causal theory.
➡︎ OPERATIONAL Thinking — A former colleague read an esteemed academic paper on US dairy policy that was prescribing potential strategies to increase production. The analysis included economic indicators like interest rates, feed prices, farming expenses — but despite having high statistical confidence, the analysis left out the one system component essential for production. Cows. Only a model that includes cows can be operational. Only operational models create clarity on levers. Yet we often create strategies based on non-operational thinking as useless as a dairy model without cows.
LINEAR Thinking — We assume working more hours will complete more work, hiring more people will impact client satisfaction, hiring a consultant will improve our capacity, and an endless stream if IF THIS THEN THAT.
➡︎ FEEDBACK LOOP Thinking — The world works with feedback loops. For example, there’s a feedback loop where more hours worked builds burnout, less completion, more hours, and more burnout. A nasty feedback loop begins to dominate as a vicious cycle. Feedback loops drive the complex dynamic behaviors experienced in the real world and must be included in our strategies and decisions.
MEASUREMENT Thinking — A commonly held belief is to make decisions only using data that we can measure precisely and represent numerically in our models. Production can be included. Burnout can’t.
➡︎ QUANTITATIVE Thinking — Anyone think Burnout doesn’t determine production? Unless you do believe it has no impact, then you know any model excluding it to be wrong. Even if unmeasured, it can still be quantified — even if anecdotally — ranging from 0-100. 0 means everyone is super relaxed; 100 means they are immobilized from burnout.
APPLYING SOME OF THE SYSQ THINKING SKILLS TO THE COUNTERINSURGENCY STRATEGY
Let’s explore how the thinking skills mentioned here can be applied to the US Afghanistan counterinsurgency strategy. We’ll use an analysis by Barry Richmond, the mastermind behind many of the SysQ thinking skills, and further explained by my colleague, Steve Peterson, in The Systems Thinker.3
Instead of looking at the latest terrorist event as something to respond to in isolation — where a strategy would be to hunt down those responsible and bring to justice — DYNAMIC Thinking would suggest it’s important to look at terrorist acts as a trend over time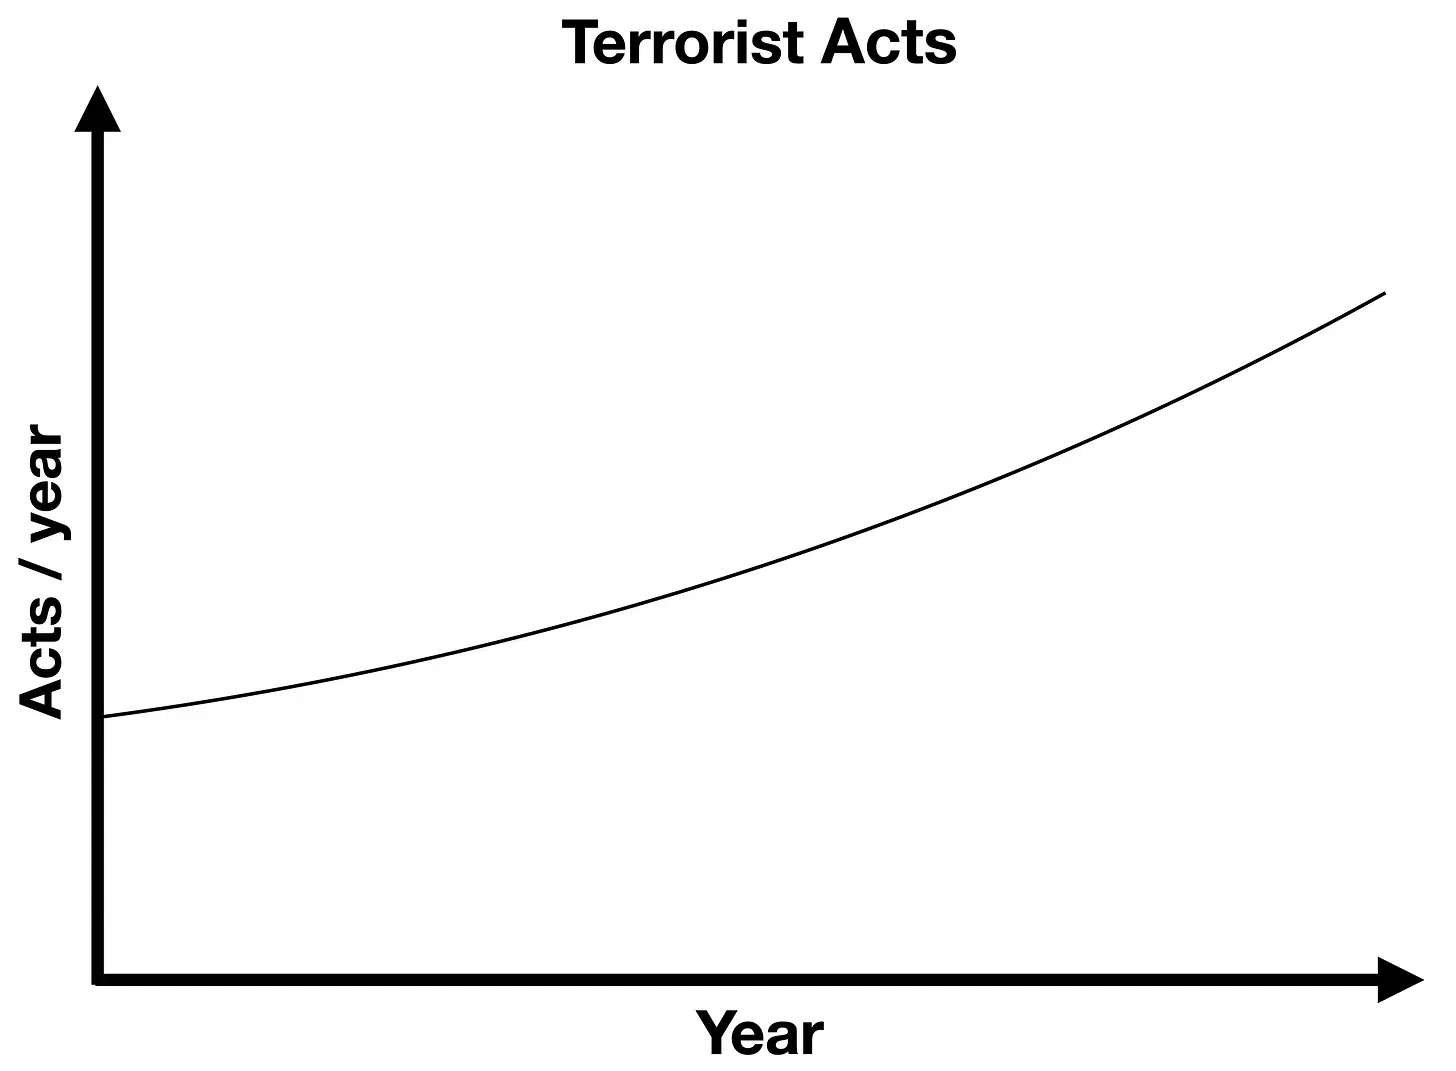
Further, FOREST Thinking would ensure that the activity of terrorism wasn’t just localized to a region within Afghanistan. Instead it would look at such activity over the breadth of the country…and perhaps the network extends even outside the borders.
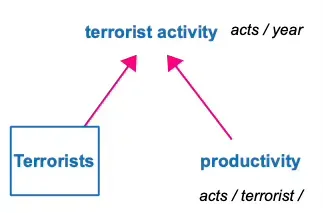
Having used SysQ to frame up the issues to be able to find leverage, we can apply OPERATIONAL Thinking. The number of terrorist acts occurring over a year is generated by two variables: the number of terrorists and their productivity (terrorist acts / terrorist / year). By making it operational, it becomes clear there are only two levers (places) to apply an intervention to reduce terrorist activity. Reduce the number of terrorists and or reduce their productivity — their terrorist acts/terrorist/year. That’s it. All solutions will be designed to work on one or both of these levers.
 LINEAR Thinking would suggest that an intervention that kills terrorists would work to reduce terrorist activity. However, by applying FEEDBACK LOOP Thinking we can see it will likely kill people who are not terrorists; this will motivate more potential terrorists to enroll in terrorist organizations and eventually be trained to commit acts. This would create a nasty reinforcing feedback loop (R1) known as a vicious cycle.
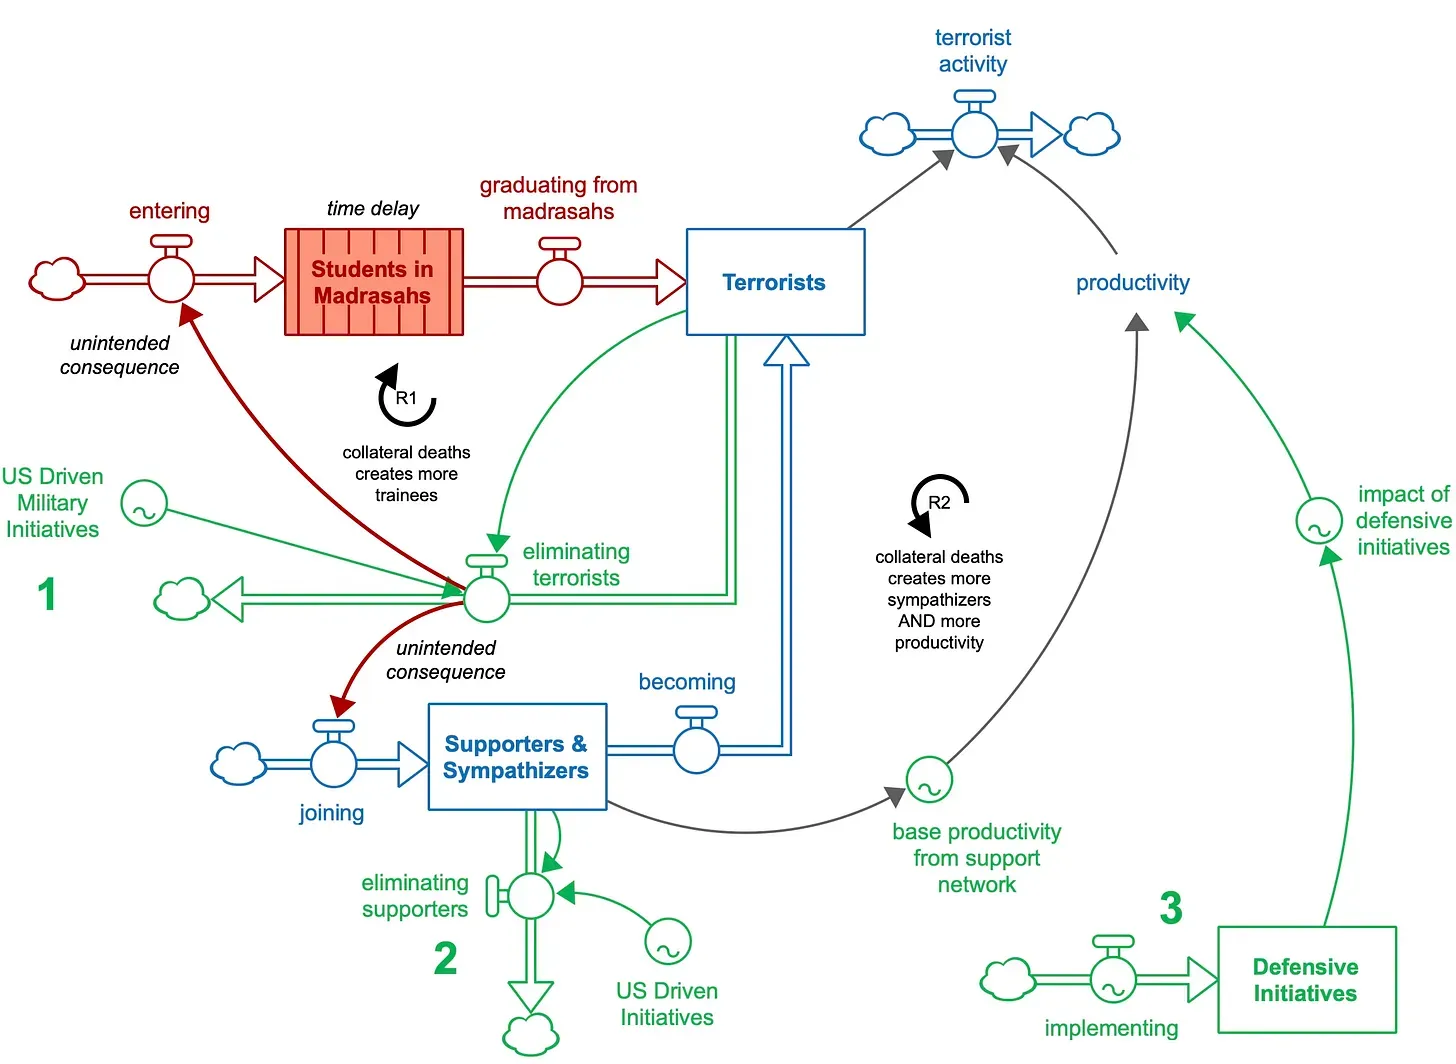
Finally, although in our simplistic view of the world, it would be awesome for our actions to only impact the intended target, we just learned with FEEDBACK LOOP Thinking that’s often not the case. In fact, by applying RIPPLE EFFECT Thinking we can see that not only would killing terrorists likely lead to more terrorists signing up. Killing innocent civilians can also lead to more sympathizers, who can increase terrorist productivity. They might provide financial resources, hide or house terrorists, or share intelligence that helps them.
In our organizations, we often think that lowering prices will boost sales. But here’s the thing: sometimes, when sales go up too high, customers aren’t happy, and sales start to drop. It’s like a balancing act.
In our communities, we usually think that the only way to stop crime is to have more police. But there are other things that can help too, like housing, unemployment, access to support for substance abuse, and even a sense of community and belonging. We need a different way of thinking, like the FOREST approach, to find effective solutions.
There are many thinking skills that are part of what I call Systemic Intelligence, which is like a superpower for thinking. These skills can help us in all sorts of areas of life. But to make better strategies and find ways to make things work, we need to use them in a process and with some tools.
SYSQ THINKING SKILLS
If you’re looking to learn practical ways to build any or all of these thinking skills, you’ve come to the right place. This substack will dive deep into each skill. There’s even a section dedicated to just the skills. And guess what? The best way to build these skills is by using some of the SysQ Tools as you learn (using the SysQ Process). Keep an eye out for articles tagged with Thinking Skills to see how they’re applied in real-world examples.
Everyone has some level of these skills, but the goal of this substack is to help us all improve and strengthen them so we’re ready to tackle the toughest problems life throws our way.
1
Bumiller, E. We Have Met the Enemy and He Is PowerPoint, New York Times (April 26, 2010), https://www.nytimes.com/2010/04/27/world/27powerpoint.html
2
Barry Richmond first proposed 7 Systems Thinking Skills of a Systems Thinker in The Thinking in Systems Thinking: How Can We Make It Easier to Master? The Waters Center for Systems Thinking has since added to those skill to create the 14 Habits of a Systems Thinker.
3
Peterson, S. Applying System Dynamics To Public Policy: the Legacy of Barry Richmond. The Systems Thinker. https://thesystemsthinker.com/applying-system-dynamics-to-public-policy-the-legacy-of-barry-richmond/
Additional Resources
Books
Book title as link | Description
Articles
Article title as link | Description
Online Resources
Resource title as link | Description
Skills
Finding Higher Leverage. The title of the resource can go here
Lorem ipsum dolor sit amet, consectetur adipiscing elit, sed do eiusmod tempor incididunt ut labore et dolore magna aliqua.
Testimonials
Clients